This article was submitted by Antreas Themistokleous, market analyst at Exness.
The trends from last week have generally resumed their bearish momentum in the new week so far, with many cyclical instruments continuing their declining movement amid this week’s economic news releases. This preview of weekly data looks at EURUSD and UKOIL ahead of the critical release on Thursday of the European Central Bank’s interest rate report.
The main event in last week was the UK inflation rate which came out to be 10.1% against market consensus of 10% which resulted in a minor correction to the upside. Also the slightly negative publications related to the US housing market also had some minor effects resulting in a small bullish correction on the EURUSD chart.
This week we have various publications coming up that can affect the markets like the Australian inflation, interest rates release from the bank of Canada, Japan and the most important publication for this week coming up on Thursday the 27th of October at 12:15 GMT regarding the publication of the interest rates from the European Central bank. Most euro related markets are expected to be quite volatile around the time of this publication.
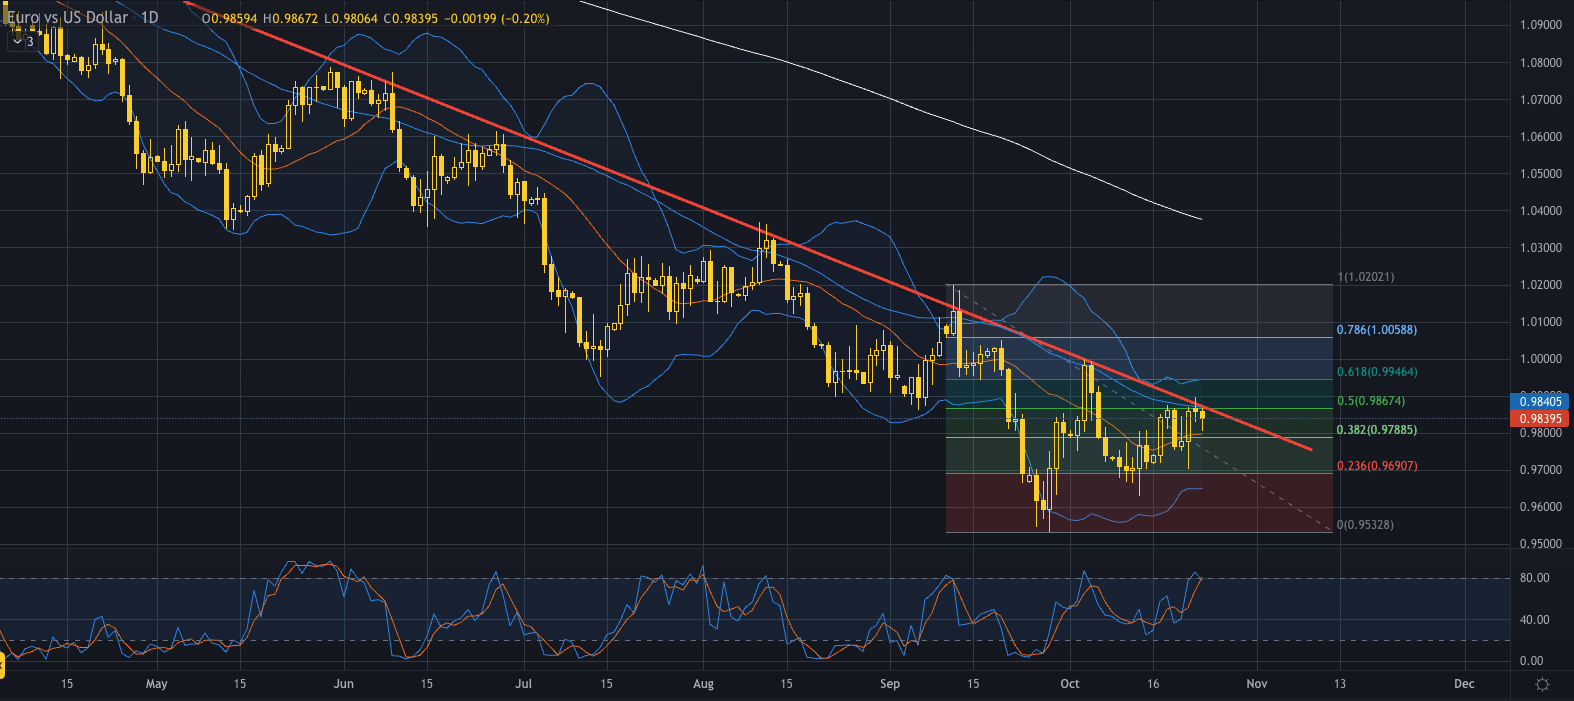
EURUSD, daily chart
The euro tested yet another time a point on the major trendline which is valid since early February 2022 before resuming its bearish movement. This retest of the upside came after the publications of the previous week regarding the US housing market which is positively correlated to the overall US economy.
From the technical analysis perspective the price is currently trading around the 0.98 price area which is a very strong point of resistance since it consists of the 50% of the fibonacci retracement level, the daily trendline and the 50 day moving average. Given that the Stochastic indicator is also signaling an overbought level and also the various resistance levels mentioned the continuation of the bearish movement is the most probable scenario on fiber with the first point of support being the 0.97885 price area which is 38.2% of the fibonacci retracement level and a second level of support being the 0.96900 price area which consists of the 23.6% of the fibonacci retracement level and also the support level of price reaction of the last swing.
Based on the publication coming on Thursday we might see a cross above the major trendline (given that the amount of buyers is stronger than the sellers) but this could be only for the short term since there are no major signals of a possible trend reversal to the upside. Based on technical analysis “the trend is your friend” and on the chart we can easily note a major bearish movement in full force so positions in that direction might make more sense.
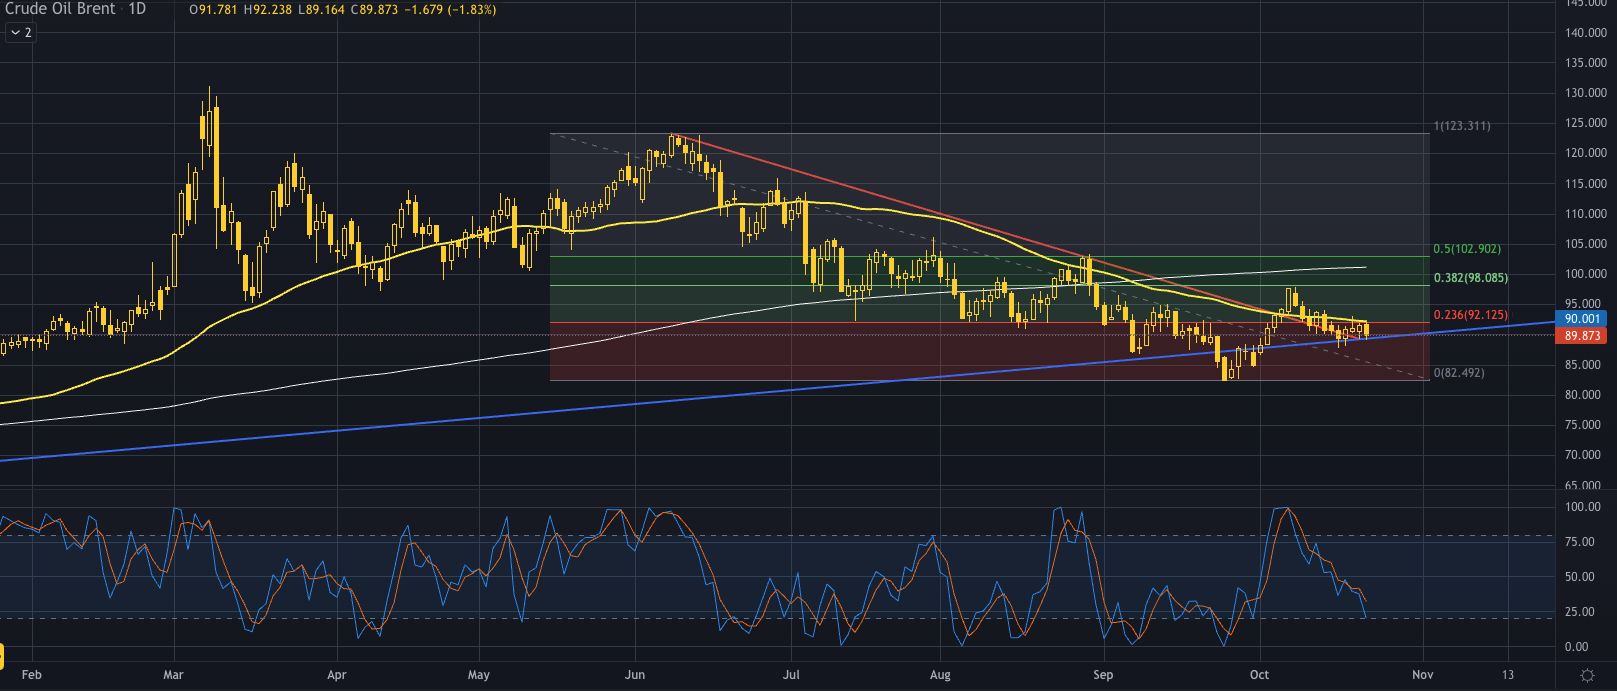
Crude oil, daily chart
The price of “black gold” is trading in a steady decline since early June with the markets not showing any signs of increased demand for it just yet. After the OPEC meeting earlier this month with the decision to cut supply of 2 million barrels per day we can easily identify the correction that pushed the price of oil to the upside only for the short term before resuming its declining momentum.
The price of oil is currently testing the psychological round number of $90 for the last 4 days without being able to break above it. The 23.6% of the Fibonacci retracement level and also the 50 day moving average act as a strong resistance to the price resulting in the price to move in a squeeze between the resistance levels and the support of the major trendline that is in force since November 2020. The Stochastic indicator is moving close to its extreme oversold levels possibly signaling a continuation of the bullish sentiment.A possible break above the 23.6% of the fibonacci would have a first level of resistance around the $98 price area which consists of the 38.2% of the fibonacci retracement level as well as the psychological resistance of round numbers.
Based on technical analysis the breakout either above the 23.6% or below the major trendline should provide a signal for trading but for the time being no trading would make any sense since it’s completely unclear if the trend is to continue to the downside or if a reversal is in the making.
Disclaimer: opinions are personal to the author and do not reflect the opinions of Exness or LeapRate.
Experienced writer and journalist, working in the global online trading sector, Steffy is the Editor of LeapRate. She has previous experience as a copywriter and has been with the company since January 2020. Steffy has a British and American Studies degree from St. Kliment Ochridski University in Sofia.