This article was submitted by Antreas Themistokleous, market analyst at Exness.
The trends from last week have generally paused in the new week so far, with many cyclical instruments recovering to some degree on Monday except for some industrial commodities while the dollar retreated in some major pairs. This preview of weekly data looks at GBPUSD and XAUUSD ahead of the critical release on Wednesday of United Kingdom’s annual inflation
The main event in last week was the US inflation rate which came out to be 8.2% against market consensus of 8.1%. The triple hike by the Fed on 2 November is expected to be almost 100% possible, especially after the publication that took place on Thursday 13 October
This week we have various publications coming up that can affect the markets like the Canadian inflation, housing permits in US showing the strength of real estate which is strongly connected with the general image of the economy, Australian unemployment rate, EU and Japanese inflation rates and probably the most important publication of the economic calendar this week, the UK inflation report being released on Wednesday October 19. Most markets will probably be quite volatile throughout the week since these publications will affect a number of instruments.
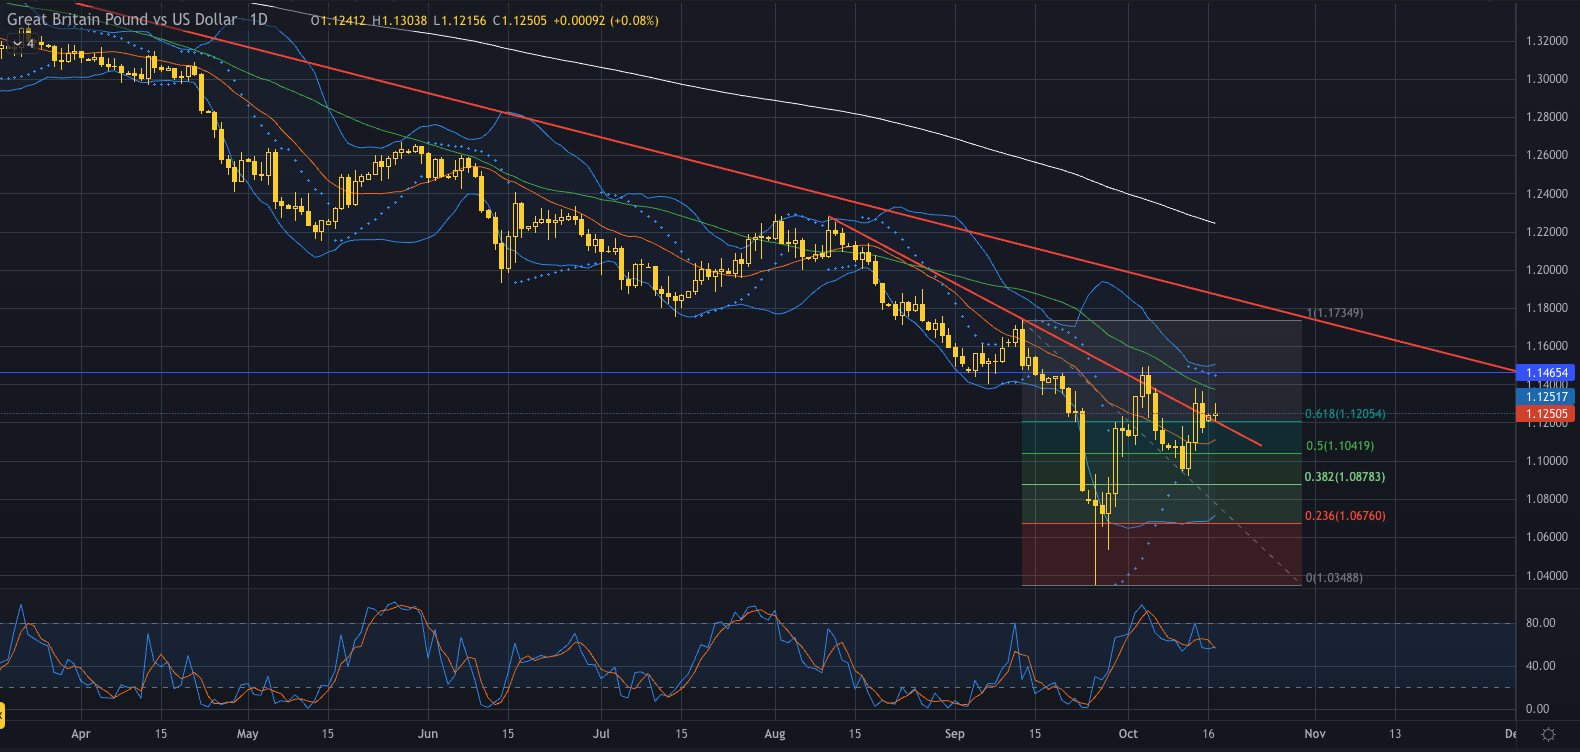
Cable, daily
The pound entered a second minor correction in the last week with the overall trend being bearish which is also confirmed by the weekly downward trendline which is still valid since February 2022. After the US inflation rate publication the US Dollar lost some momentum enabling these minor swings to happen on the charts and the upcoming publication for the UK inflation report is expected to have some effect on the cable chart depending on the numbers published.
Based on technical analysis the price is currently trading around the 1.24 price area which is a very strong point of resistance since it consists of the 61.8% of the fibonacci retracement level, the daily trendline which is valid since mid August and the psychological resistance of round numbers. Given this is a major resistance level on the chart the continuation of the downward movement is the most probable scenario on cable with the first point of support being the 1.105 price area which is a psychological support number and also the 50% of the fibonacci retracement level. There is no signal of oversold from the indicators so trading the direction of the actual release happening on Wednesday instead of entering now (except to scalp) might make sense.
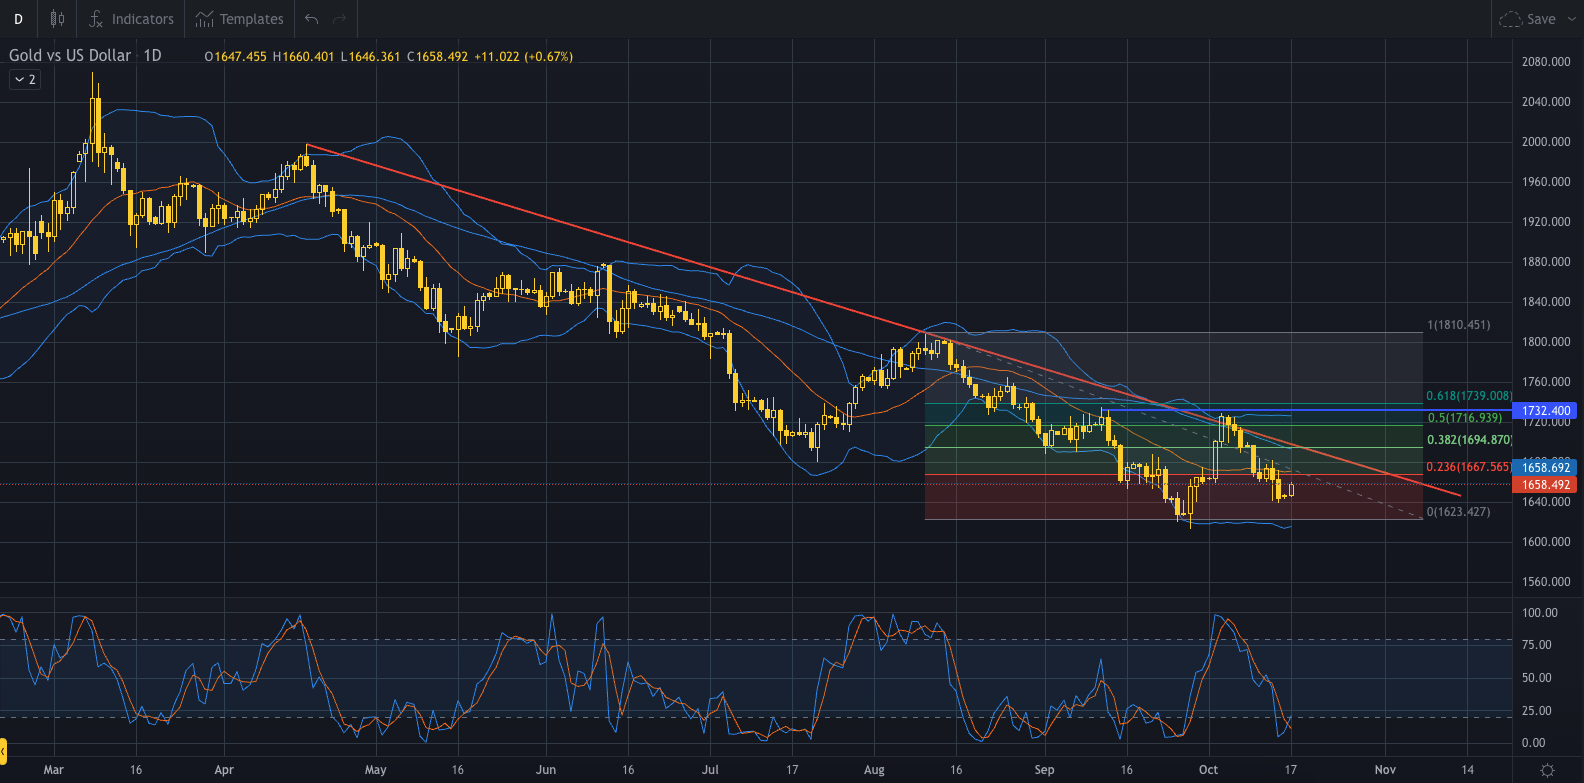
Following the US inflation report last week the number is slightly lower (8.2%) than last month (8.3%) gold continued the declining rally that is in motion for the last two weeks. After the NFP release and the latest inflation report of last week ,the likelihood of 4.5-4.75% by the end of the year has increased significantly, now around 64%.
The price of gold has resumed the downward movement after finding resistance on the major trendline early October. The Stochastic indicator shows an oversold level possibly signaling a correction to the upside. If such a correction is initiated we would expect a resistance level around the $1690s price area which consists of a point on the trendline and also the 38.2% of the fibonacci retracement level. Given the price continues its bearish rally we would expect a support level at around the $1620s price area which consists of the lower band of the Bollinger bands and also the latest support area of the last swing,
Disclaimer: opinions are personal to the author and do not reflect the opinions of Exness or LeapRate.
Experienced writer and journalist, working in the global online trading sector, Steffy is the Editor of LeapRate. She has previous experience as a copywriter and has been with the company since January 2020. Steffy has a British and American Studies degree from St. Kliment Ochridski University in Sofia.