This article was submitted by Antreas Themistokleous, market analyst at Exness.
The trends from last week have generally rebounded in a bullish momentum in the new week so far, with many cyclical instruments slowly moving to the upside just before this week’s economic news releases. This preview of weekly data looks at EURUSD and UKOIL ahead of the critical release on Thursday of the US interest rate report.
The main events in last week was the EU inflation rate and GDP growth which came out to be 10.7% and 2.1% respectively which resulted in losses for the Euro. Reports related to USD in the previous week was manufacturing and non-manufacturing PMI which both were above 50 indicating that both manufacturing and non-manufacturing sectors are growing. In addition on Wednesday November 2nd the FED announced a triple hike on interest rates reaching up to 4% , unemployment rates showed slight increase coming out to be 3.7% against the previous of 3.5% and also we had the NFP release on Friday November 4th showing an addition of 261 thousand jobs for October against the market expectations of 200 thousand. All these publications created volatility in the markets with the chart of EUR/USD declining to $0.97280 before bouncing back at $0.99570 on the close of November 4th.
This week we have activities coming up that can affect the markets like the US midterm elections on the 8th of November, the US inflation rate set to be published on Thursday November 10th at 13:30 GMT and the UK GDP release on Friday November 11th at 07:00 GMT. Most USD related pairs are expected to be quite volatile especially around the time of the inflation rate publication..
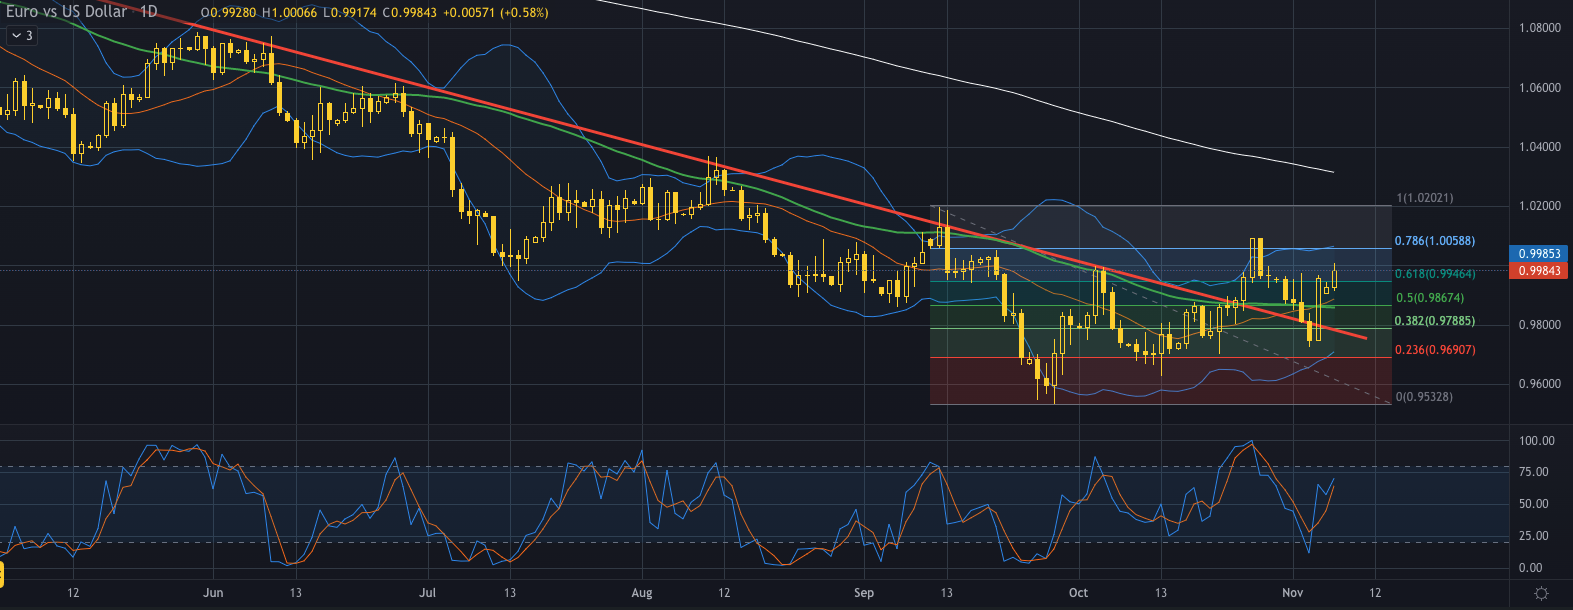
EURUSD, daily chart
Following last week’s publications that were somewhat positive for the Dollar (lower GDP, increased inflation rates for the Euro, increased US PMI and triple hike from the FED) in the early days of previous week ending with an increased unemployment rate in the States the price reacted accordingly. After breaking above the trendline which is valid since early February 2022 and finding resistance just above the 78.6% of the Fibonacci retracement level , it rebounded to retest the trendline and resumed the bullish momentum reaching back at the $0.99800 price area.
From the technical analysis perspective the price is currently trading around the 0.99900 price area just above the 61.8% of the fibonacci retracement level. The US inflation rate is expected to affect the fiber chart with the market expecting a decrease on the figure (8%). This publication will possibly create volatility and might give the bears some more power to push the price to the downside. If this is the case the first point of support might be the $0.98700 price area which consists of the 50% of the Fibonacci and also the 50 day moving average. A second point of support might be the $0.97900 price area which falls around the 38.2% of the Fibonacci and also the major trendline. A continuation to the upside would probably face some resistance around the $1.00600 area which consists of the 78.6% of the fibonacci.
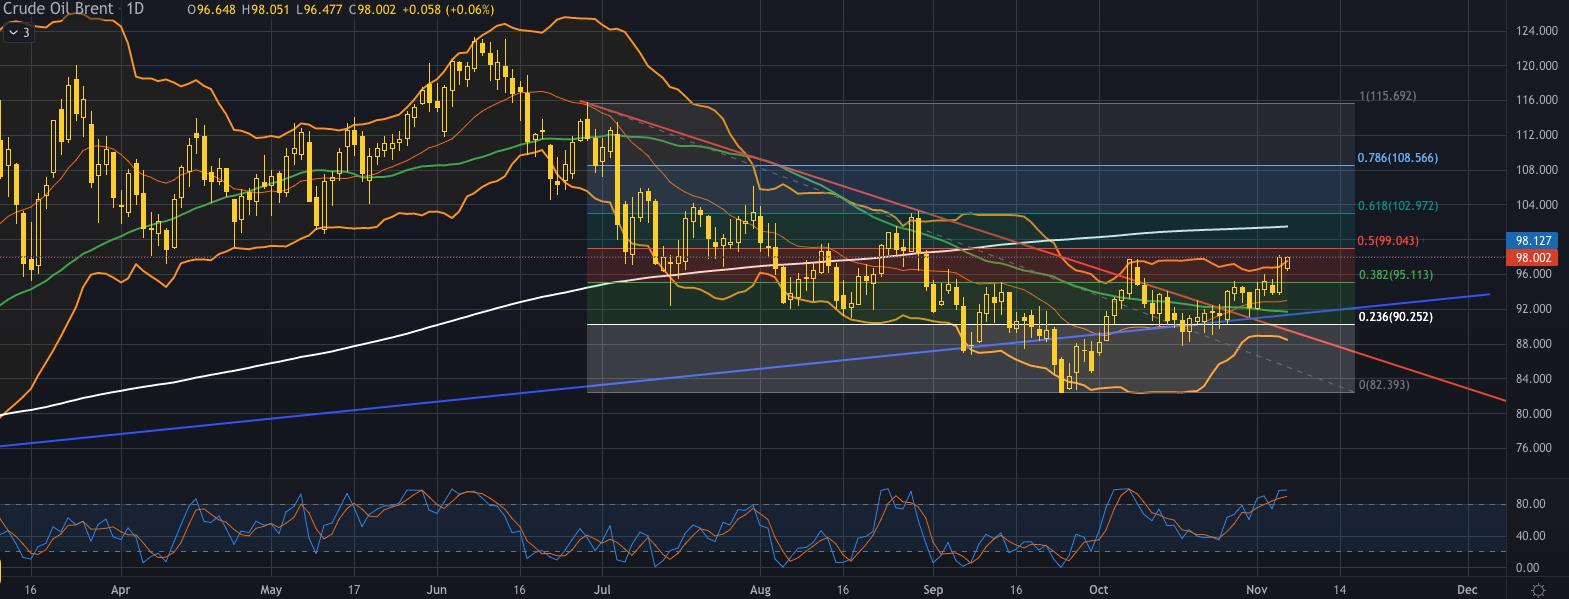
The price of Brent oil bounced to the upside after a week of lower supply which was announced on 5th of October at the OPEC meeting. The cut of the 2 million barrels per day came into effect on November 2nd with the price of “black gold” reacted accordingly.
After the break above the bearish trendline and the 50 day moving average the price found resistance on the upper band of the Bollinger bands just below the 50% of the Fibonacci retracement level. Currently the price is trading around the $98 price area exactly on the upper band of Bollinger bands. This indicates great volatility on the market with the bands showing an indication of expansion signaling the volume still goes strong. The Stochastic indicator is in the overbought levels possibly indicating that a correction to the downside is a possible scenario in the short term.
If the price finds adequate resistance on the Bollinger bands and corrects to the downside we might expect some support around the $ 92 price area which is a point on the major weekly trendline valid since November 2020 and also the 50 day moving average. If the bullish momentum is to continue then we can possibly see some resistance around the $99.100 price area just above the 50% of the Fibonacci retracement level and the psychological resistance of the round number.
Disclaimer: opinions are personal to the author and do not reflect the opinions of Exness or LeapRate.
Experienced writer and journalist, working in the global online trading sector, Steffy is the Editor of LeapRate. She has previous experience as a copywriter and has been with the company since January 2020. Steffy has a British and American Studies degree from St. Kliment Ochridski University in Sofia.