This article was submitted by Antreas Themistokleous, market analyst at Exness.
This preview of weekly data looks at UKOIL and XAUUSD which have resumed their downward momentum after almost a month of an upward correction movement. Oil is retesting the bearish trendline while gold is currently trading above the major downward trendline.
The main events in last week were the UK unemployment rate and Claimant count change, UK inflation rate, Canadian inflation rate, Australian unemployment rate and some news related to the US housing market like Building Permits,Housing Starts and Existing Home Sales where all the data related to the housing market are showing a decline in expansion of development for real estate which could be an early sign of negative growth in the near future.
This week investors turn their attention to the FOMC minutes on Wednesday 23rd of November at 07:00 PM GMT where borrowing cost is already at new highs of 2008. The focus of the FED is solely focused on bringing down the inflation rate in the 2% area which remains at a 40 year high. In the press conference Chair Powell also noted the ultimate level of interest rates will be higher than previously expected while the markets are expecting a smaller hike in the December FED meeting.
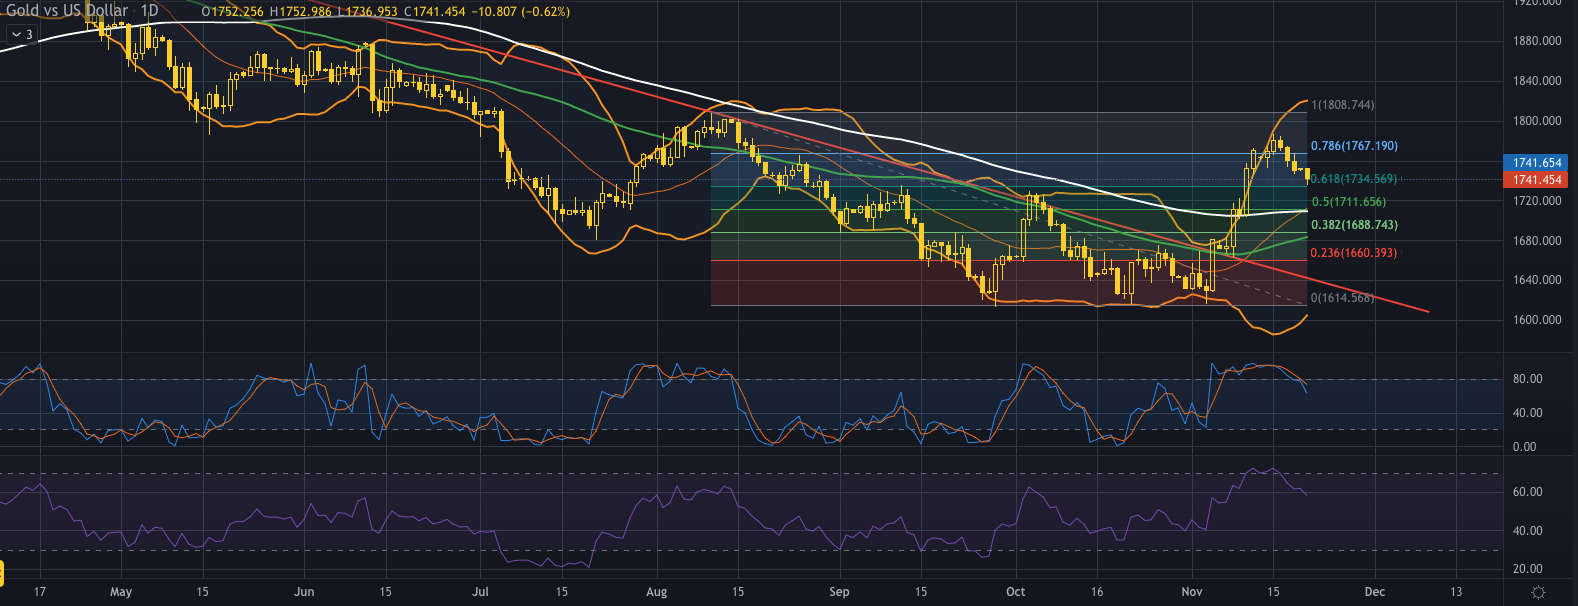
Gold, daily
The last 4 day decline in the price of the “yellow metal” has created a bull flag formation while the RSI indicator is still holding above the midline, possibly signaling that the bulls are still keeping strong at least for now. While the market is expecting higher interest rates from the FED this discourages investing in gold and with the FOMC minutes happening this week the price already declined ahead of this event, The US dollar index shows a more strengthened Dollar pushing the price of gold down.
On the technical analysis point of view the price is currently trading around the $1,740just above the 61.8% of the Fibonacci retracement level. With a bear flag formation forming in the last 4 days we might see some continuation to the downside with a very strong area of support around the $1,712 price area which consists of the 50% of the Fibonacci retracement level and the 100 day moving average as well as an inside support area of early October.
If the bulls are proven to be strong in the short term we might see some correction to the upside with a first area of resistance being around the $1,770 just above the 78.6% of the Fibonacci and also the psychological resistance of a round number.
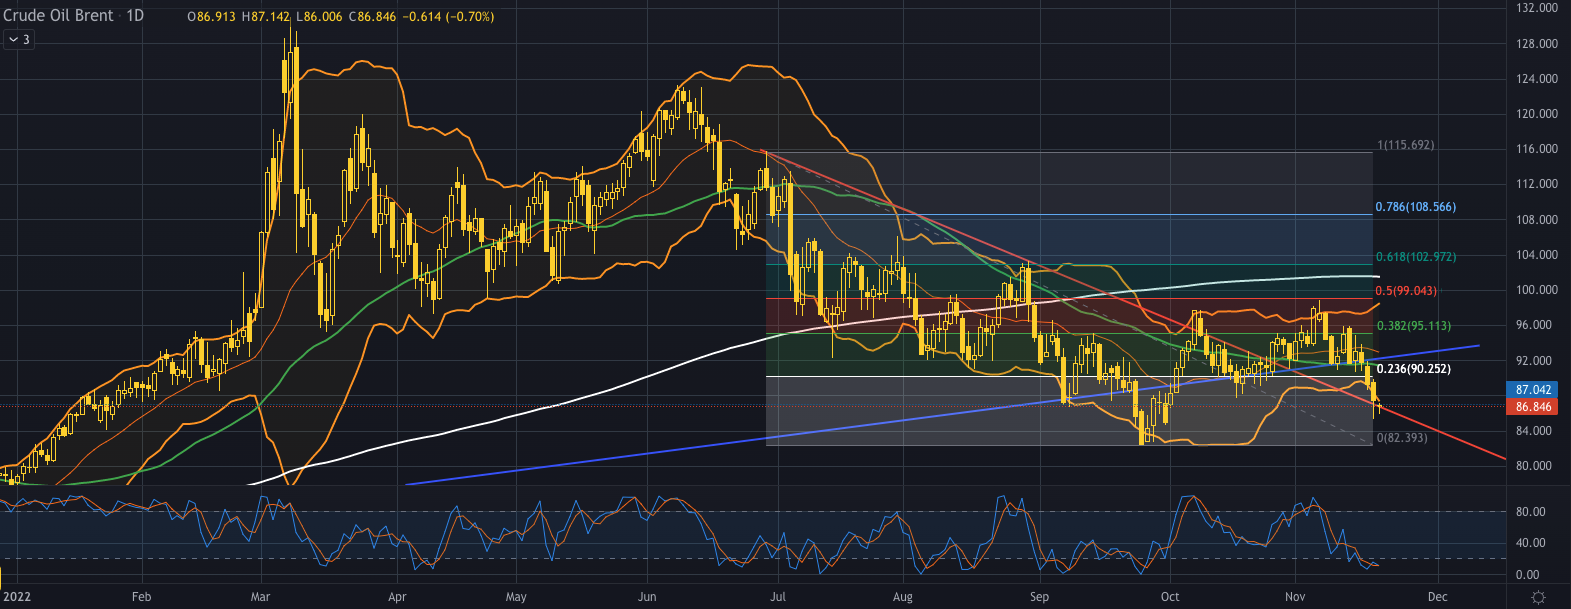
Oil, daily
Europe’s ability to pivot in acquiring the “black gold” from the Middle East, Latin America and the United States gave European refiners a sigh of relief. Asia demanded less oil against any analyst predictions especially because of the battle of China for its zero – covid goal. There were 3 deaths recorded over the weekend in China because of Covid reigniting the possibility of more lockdown’s in the world’s top oil importer which will result in denting the demand for it.
On the technical side the price of oil is currently trading at the $87 area, testing the daily bearish trendline after breaking below the major weekly trendline which was valid since November 2020. It is worth noting that the price is trading outside of the Bollinger bands indicating high volatility in the market and with the Stochastic indicator in the oversold levels we might expect some correction to the upside in the following days.
If the price corrects to the upside we might expect the first point of resistance being around the $91 area which is just above the 23.6% of the Fibonacci retracement level and also is a point on the major weekly trendline. In the event that the price continues to push down we might expect the first point of resistance being around the $82.40 price area which is the 0% of the Fibonacci and also the support area of the last major swing that happened in late September.
Disclaimer: opinions are personal to the author and do not reflect the opinions of Exness or LeapRate.
Experienced writer and journalist, working in the global online trading sector, Steffy is the Editor of LeapRate. She has previous experience as a copywriter and has been with the company since January 2020. Steffy has a British and American Studies degree from St. Kliment Ochridski University in Sofia.