This article was submitted by Aaron Hill from FP Markets.
Following Thursday’s ADP employment scorcher for June (497,000 vs 257,000 in May) and the US ISM services PMI (June) also coming in hotter than expected at 53.9, up from 50.3 in May, Friday’s headline employment report was mixed. With some desks expressing concern that the headline employment number would echo the ADP release, the US economy added 209,000 new payrolls in June, undershooting economists’ estimates for the first time since April 2022 (versus May’s downwardly revised 306,000 print). Unemployment, however, ticked lower to 3.6%, down from 3.7%, and wage growth was up 0.4% MoM (consensus 0.3%) and 4.4% YoY (consensus 4.2%).
Given the latest minutes from June’s Fed meeting, together with the latest US employment data, as well as reasonably robust US economic growth (real GDP increased at an annual rate of 2.0% in Q1 [2023]) and surprising strength in the US housing market, I do not see Friday’s employment numbers being enough to derail a Fed hike later this month. Markets are almost fully pricing in a 25bp hike alongside a terminal rate now at 5.44% in November this year. Notably, we can also see that investors are now expecting higher rates for longer, with cuts not anticipated until mid-2024. You will likely recall that some rather heavy-hitting movement in the US bond market unfolded last week; the short-dated 2-year US Treasury yield rallied to an eye-popping 16-year high of 5.12%, as well as the benchmark 10-year US Treasury yield advancing to 4.08%, after Thursday’s bumper ADP employment release. Despite yields rallying, the Dollar Index ended the week on the back foot, which could simply reflect the strength in the euro, the British pound and the Japanese yen (combined, all three currencies control circa 83% of the weight in the US Dollar Index). I added a technical view of the US Dollar Index below, which suggests a medium-term bearish viewpoint.
Wednesday will be a busy one this week, and US inflation (CPI) data will be front and centre at 1:30 pm GMT+1. YoY, headline inflation is expected to slow to 3.1% in June, down from 4.0% in May. YoY core inflation (that is, inflation excluding food and energy) is also expected to cool to 5.0% in June, 0.3 percentage points lower than 5.3% in May. On a MoM basis, consumer prices are expected to increase 0.2 percentage points to 0.3% for June, up from 0.1% in May (while MoM core inflation is anticipated to slow to 0.3%). Although softer inflation is welcomed, it will unlikely alter the chances of a Fed hike this month, though it may adjust longer-term interest-rate expectations.
Wednesday also welcomes rate decisions from the Reserve Bank of New Zealand (RBNZ) at 3:00 am GMT+1 and the Bank of Canada (BoC) at 3:00 pm GMT+1. The RBNZ, following May’s 25bp rate increase, is expected to leave the Official Cash Rate on hold at 5.50%, while markets are pricing in a 70% chance that the BoC will increase the Official Overnight Rate again by 25bps to 5.0% (you may recall that June’s meeting defied expectations and saw a 25bp hike amid persistent inflationary pressures; this followed a five-month break in policy firming).
Thursday’s US PPI inflation (Producer Price Index) release is also an important economic data point this week at 1:30 pm GMT+1. The consensus heading into the event is for producer prices to have rose 0.4% in the twelve months to June, down from 1.1% in May (core inflation is expected to slow to 2.7% YoY).
Additional events to be conscious of this week are UK data on Tuesday at 7:00 am GMT+1, that is, jobs data and average earnings, and US UoM consumer sentiment data on Friday at 3:00 pm GMT+1. You may recall that the annual growth in wages in the three months to April (excluding bonuses) increased to 7.2%, up from 6.7%, which marks the largest increase on record, with total pay (including bonuses) up 6.5% (from 6.1%). This week’s wage numbers and the inflation release on 19 July are key ahead of the Bank of England (BoE) rate decision on 3 August (markets are pricing in a 70% probability of a 25bp hike, following June’s surprise 50bp increase).
G10 FX (5-Day Change):
Technical View: Markets to Watch for the Week Ahead
Currencies:
US Dollar Eyeing the 101.92 Low
With Friday’s one-sided decline, it was a disappointing week for the Dollar Index, down -0.6%.
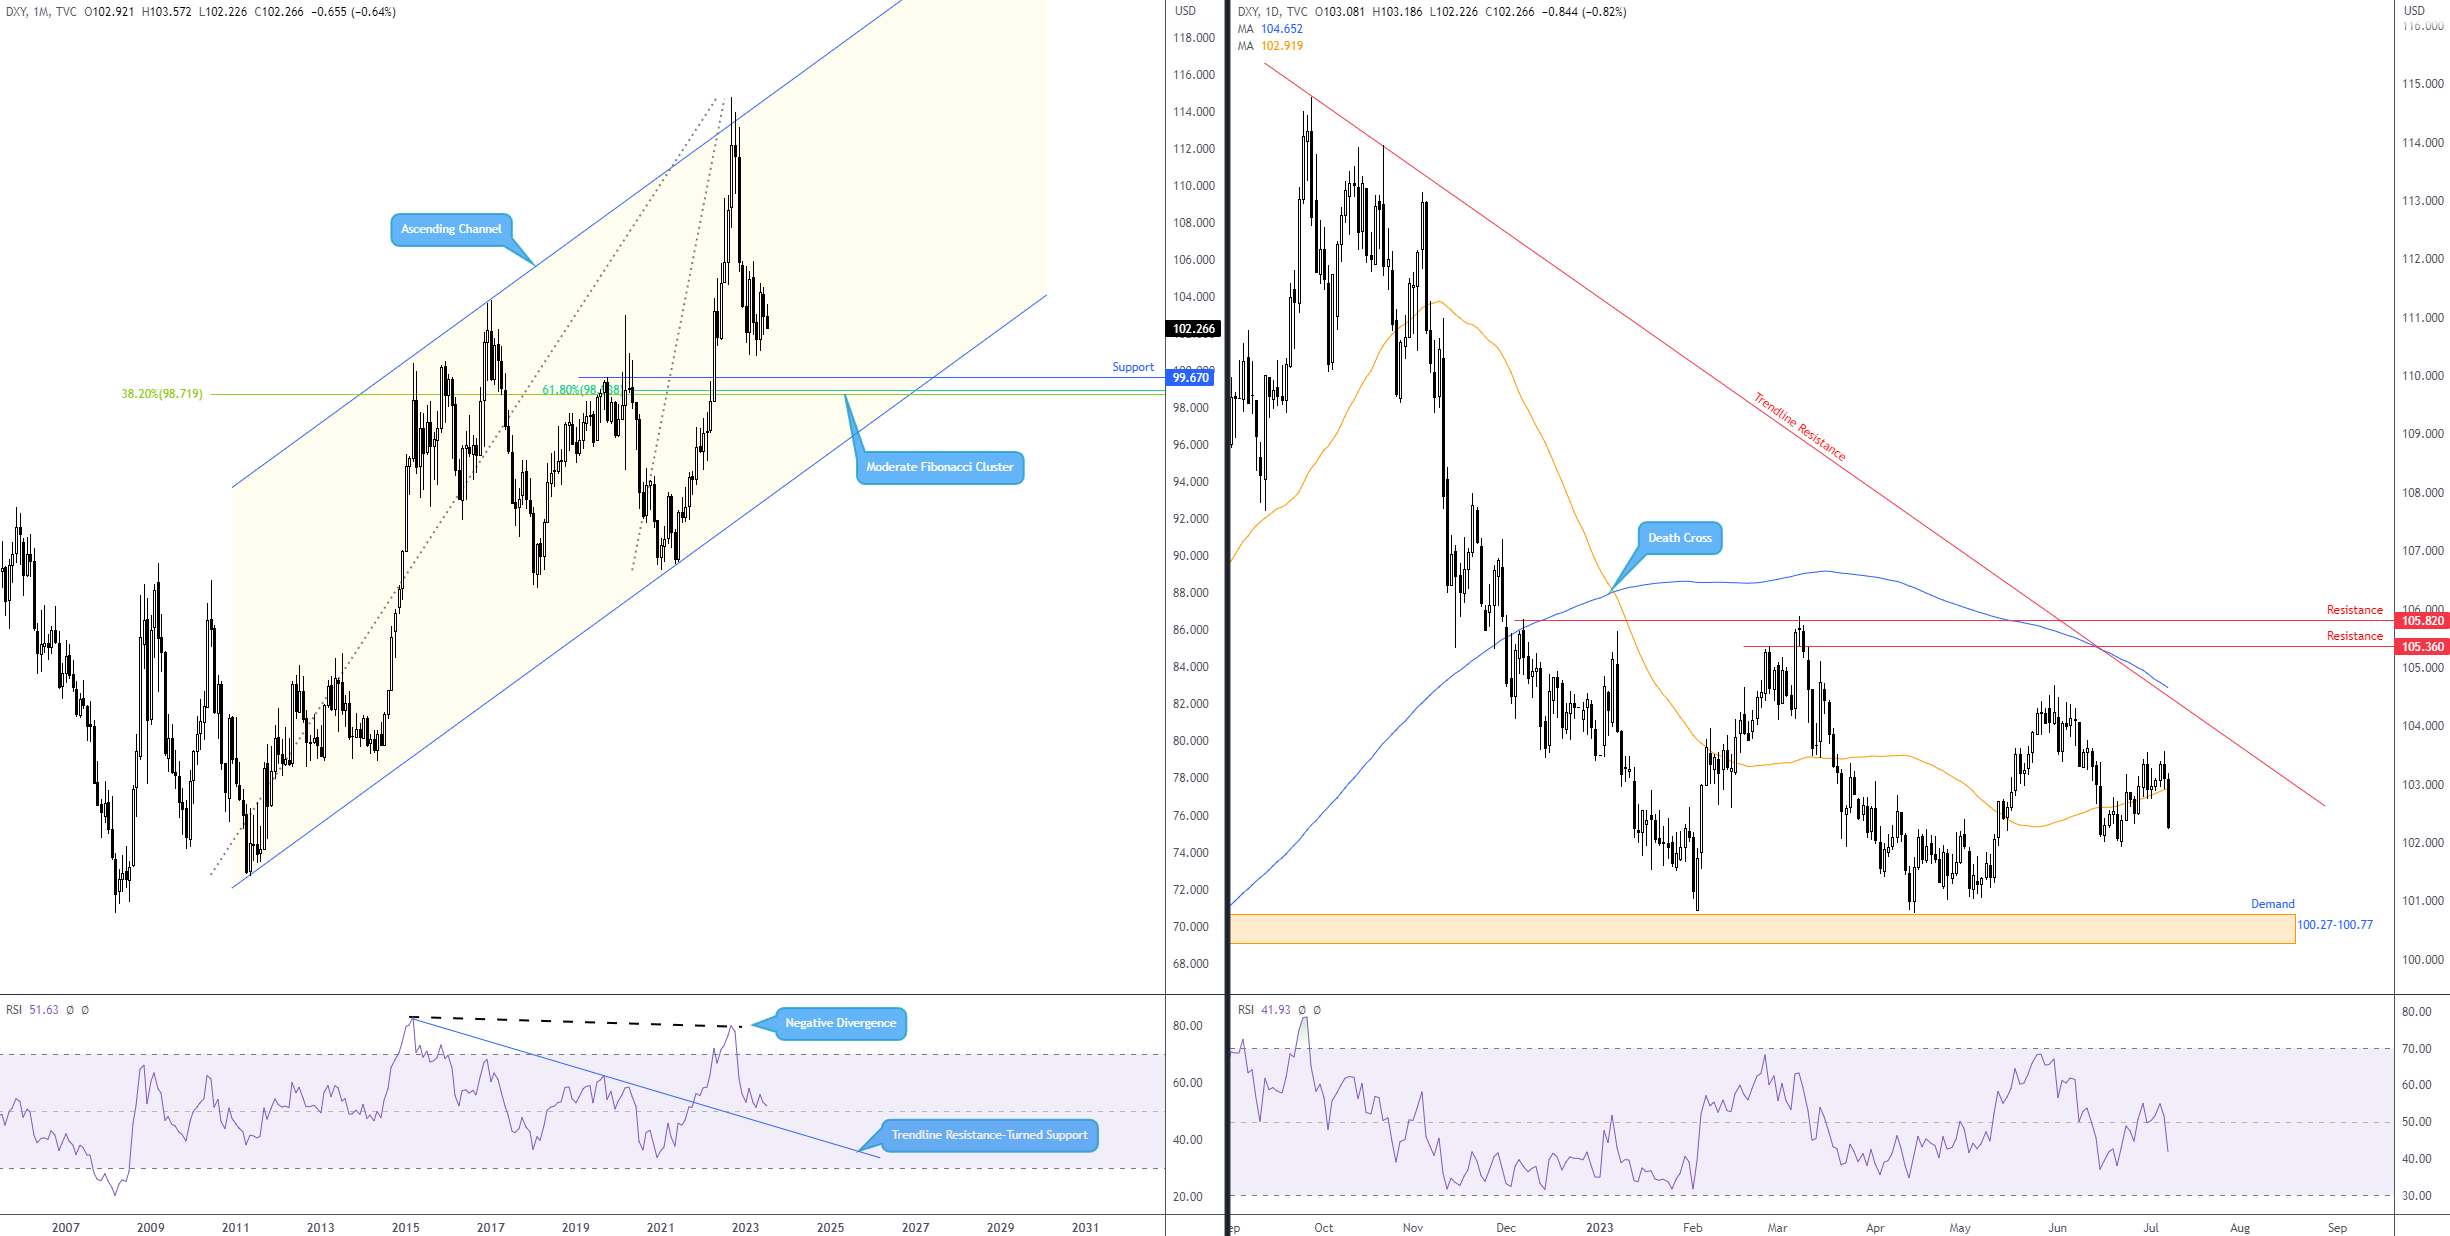
Trend studies on the monthly timeframe show price action has been northbound since bottoming in 2008 at 70.70. Q4 (2022), as you can see, staged a noteworthy correction from 114.78 (from channel resistance), which remains active in 2023. Predictably, due to the fractal nature of the markets, this displayed a visible downtrend on the daily chart, which also remains active.
In previous writing, I communicated the following regarding the monthly scale (italics):
Should price action on the monthly timeframe extend the current retracement slide—obvious support is not seen until 99.67, a level complemented by two Fibonacci ratios (38.2% and 61.8%) at 98.72 and 98.95, respectively—this may pull the Relative Strength Index (RSI) under the 50.00 centreline to a nearby indicator trendline resistance-turned-support drawn from the high of 82.87. It is worth remembering that the RSI tends to establish support around the 40.00-50.00 area in trending environments; consequently, many use this zone as a temporary oversold base to locate positive divergences.
Across the page on the daily timeframe, downside gained speed on Friday and tore through the 50-day simple moving average (currently 102.92). This—coupled with the aptly termed Death Cross (50-day simple moving average crossing below the 200-day simple moving average [104.65]) gracing our chart at the beginning of the year—implies sellers are in the driving seat. Additional USD underperformance could see the currency confront 101.92 (22 June low), with subsequent selling pressure paving the way towards familiar demand from 100.27-100.77. Also swinging the technical pendulum in favour of further selling this week is the daily chart’s RSI finding acceptance beneath the 50.00 centreline, informing traders/investors that average losses exceed average gains (in other words, negative momentum).
Considering the above-noted points, chart studies favour USD sellers at least until 101.92, particularly if the buck remains beneath the 50-day SMA. Rupturing 101.92 could also open the door for medium-term breakout selling in the direction of daily demand at 100.27-100.77.
EUR/USD: Pennant Pattern Upside Breakout
Daily Timeframe –
Another currency that has earned a spot on this week’s Market Insight is the euro. Against the US dollar, Europe’s shared currency advanced 0.5% last week; a large portion of that upside was seen on Friday.
For those who read the previous analysis, you may recall that EUR/USD has been testing the mettle of the 50-day simple moving average since late June (currently $1.0858). Withstanding several downside attempts, buyers eventually put in an appearance on Friday and rallied +0.7%. As a result, a breakout above a pennant pattern emerged (fixed between $1.1012 and $1.0844), offering buyers a potential breakout opportunity. While the identification of the pole can be subjective, I selected between the low of $1.0733 to the high of $1.1012. Consequently, Friday’s upside breakout will encourage pattern traders to extend the value of the pole from the breakout point to identify a profit objective (blue arrows), which, according to this chart, is at $1.1184 (north of resistance at $1.1138).
Based on daily chart studies, buyers will likely remain at the wheel this week, targeting the YTD high of $1.1096, followed by resistance at $1.1138 and finally, the pennant pattern’s profit objective at $1.1184.
Commodities:
Spot Silver (XAG/USD) Echoing a Bearish Vibe
It was another positive week for spot silver. In dollar terms, the precious metal rallied +1.4% and notched up a second week in the green.
Is this surprising? No.
Will the bulls remain in control in the medium term? Unlikely, according to technical studies.
You will acknowledge that price action rebounded from support on the weekly timeframe at $22.42. However, although the weekly scale has been trending higher since August 2022, the rebound from support does not inspire confidence. We have barely made a mark on the -7.3% drop in June. Unless buyers change gears here, consuming $22.42 could be on the table, a move that would expose weekly support coming in at $20.82.
Interestingly, occupying the daily chart is a potential bearish pennant pattern between $22.11 and $23.10. In fact, this pattern, which tends to be viewed as a bearish continuation signal, represents the 2-week reaction seen from the weekly support mentioned above at $22.42. Adding to the bearish cloud brewing over this market is the daily Relative Strength Index (RSI) closing in on the underside of the 50.00 centreline (this area often holds as [indicator] resistance). A breakout beneath the pennant pattern’s lower boundary this week will likely stimulate follow-through selling and unearth a harmonic bat pattern’s potential reversal zone (PRZ) between $20.13 and $20.84.
Against the bigger picture, short-term price action out of the H1 chart travelled beyond $23.00 on Friday and cast light on resistance between $23.42 and $23.25, comprising three individual resistance levels. This could be the line in the sand for bears, as the above-noted resistance zone converges closely with the upper border of the daily timeframe’s pennant pattern. Therefore, $23.42-$23.25 is an area worthy of the watchlist this week and might be a zone that sellers welcome, particularly as the H1 timeframe’s RSI indicator also explores overbought space.
Equities:
Technicals Suggest Weakness for Tesla (TSLA)
Thanks to robust demand for TSLA—last week’s bullish weekend gap and June adding nearly 30%—a harmonic bat pattern’s potential reversal zone (PRZ) between $300.79 and $283.88 was identified on the weekly timeframe. As you can see, the aforementioned PRZ welcomed price in recent trading. Additionally, the weekly Relative Strength Index (RSI) is simultaneously on the verge of shaking hands with overbought territory. While this reflects a potentially bearish atmosphere, it’s imperative to note that price action could still test the entire space of the PRZ (as far north as $300.79). So, buyers may still push at least towards the converging weekly trendline resistance taken from the all-time high of $414.50.
Across the page on the daily timeframe, a Golden Cross (50-day simple moving average [$212.54] crossing above the 200-day simple moving average [$194.04]) formed in late June, traditionally recognised as a longer-term bullish trend signal. Yet, we can see that the RSI, also on the daily timeframe, threatens to form negative divergence at overbought territory.
Concerning technical structure on the daily scale, demand is visible at $247.51-$261.97, and a channel resistance entered the fray last week extended from the high of $214.00. Beyond here, resistance calls for attention at $311.46, plotted outside the weekly PRZ.
Ultimately, with daily channel resistance in play, aided by the daily chart’s RSI pencilling in possible negative divergence (and the weekly chart’s RSI within striking distance of overbought) and the weekly timeframe challenging the lower boundary of a harmonic bat pattern’s PRZ, this could prove a formidable (technical) headwind for buyers this week/this month. As such, dropping in on daily demand at $247.51-$261.97 should not surprise.
Cryptocurrencies:
LTC/USD: Buyers in Control Following Recent YTD Pinnacle?
Daily Timeframe –
Technically, LTC/USD has gradually trended higher since bottoming in mid-June at $40.32 (2022). At the beginning of last week, we also saw the unit refresh YTD highs at $114.98, though we did spend the remainder of the week giving up ground.
Friday ended with testing support from $95.13, which, as you can see, attracted moderate dip buying. Failure to defend this level opens the possibility of testing demand at $84.65-$87.40, an area that currently shares chart space with the 50-day and 200-day simple moving averages at $89.38 and $87.83, respectively. We also observed the 50-day SMA rebound from the 200-day SMA in late June (many were calling for the possibility of a Death Cross at this point [long-term bearish trend signal]). However, validating this signal would be difficult, given that the pair has been somewhat directionless since mid-February, formed by way of a symmetrical triangle (sometimes referred to as a coil or isosceles triangle), which, incidentally, welcomed a breakout to the upside at the end of June. But, because of last week’s correction, we are now back within the space of the symmetrical triangle. It is important to consider that the breakout higher may have simply been a whipsaw/fakeout (common with symmetrical triangles).
Ultimately, given the uptrend in play, and because of the recent YTD high and breakout above a reasonably long-term symmetrical triangle, as well as support offering a floor from $95.13, buyers could emerge from current price this week. The caveat to this, of course, is that the demand seen at $84.65-$87.40 offers more of a technically confluent area, with both the 50-day and 200-day SMAs nearby (possible [dynamic] support) and, thus, could haul price action lower towards this region before buyers step in.
Charts: TradingView
Report from last week: Technical analysis: Sterling under pressure following gov. Bailey’s comments… Read More
Disclaimer: The information contained in this material is intended for general advice only. It does not take into account your investment objectives, financial situation or particular needs. FP Markets has made every effort to ensure the accuracy of the information as at the date of publication. FP Markets does not give any warranty or representation as to the material. Examples included in this material are for illustrative purposes only. To the extent permitted by law, FP Markets and its employees shall not be liable for any loss or damage arising in any way (including by way of negligence) from or in connection with any information provided in or omitted from this material. Features of the FP Markets products including applicable fees and charges are outlined in the Product Disclosure Statements available from FP Markets website, www.fpmarkets.com and should be considered before deciding to deal in those products. Derivatives can be risky; losses can exceed your initial payment. FP Markets recommends that you seek independent advice. First Prudential Markets Pty Ltd trading as FP Markets ABN 16 112 600 281, Australian Financial Services License Number 286354.
Opinions are personal to the authors and do not reflect the opinions of LeapRate. This is not a trading advice.
Experienced writer and journalist, working in the global online trading sector, Steffy is the Editor of LeapRate. She has previous experience as a copywriter and has been with the company since January 2020. Steffy has a British and American Studies degree from St. Kliment Ochridski University in Sofia.


 EUR/USD: Pennant Pattern Upside Breakout
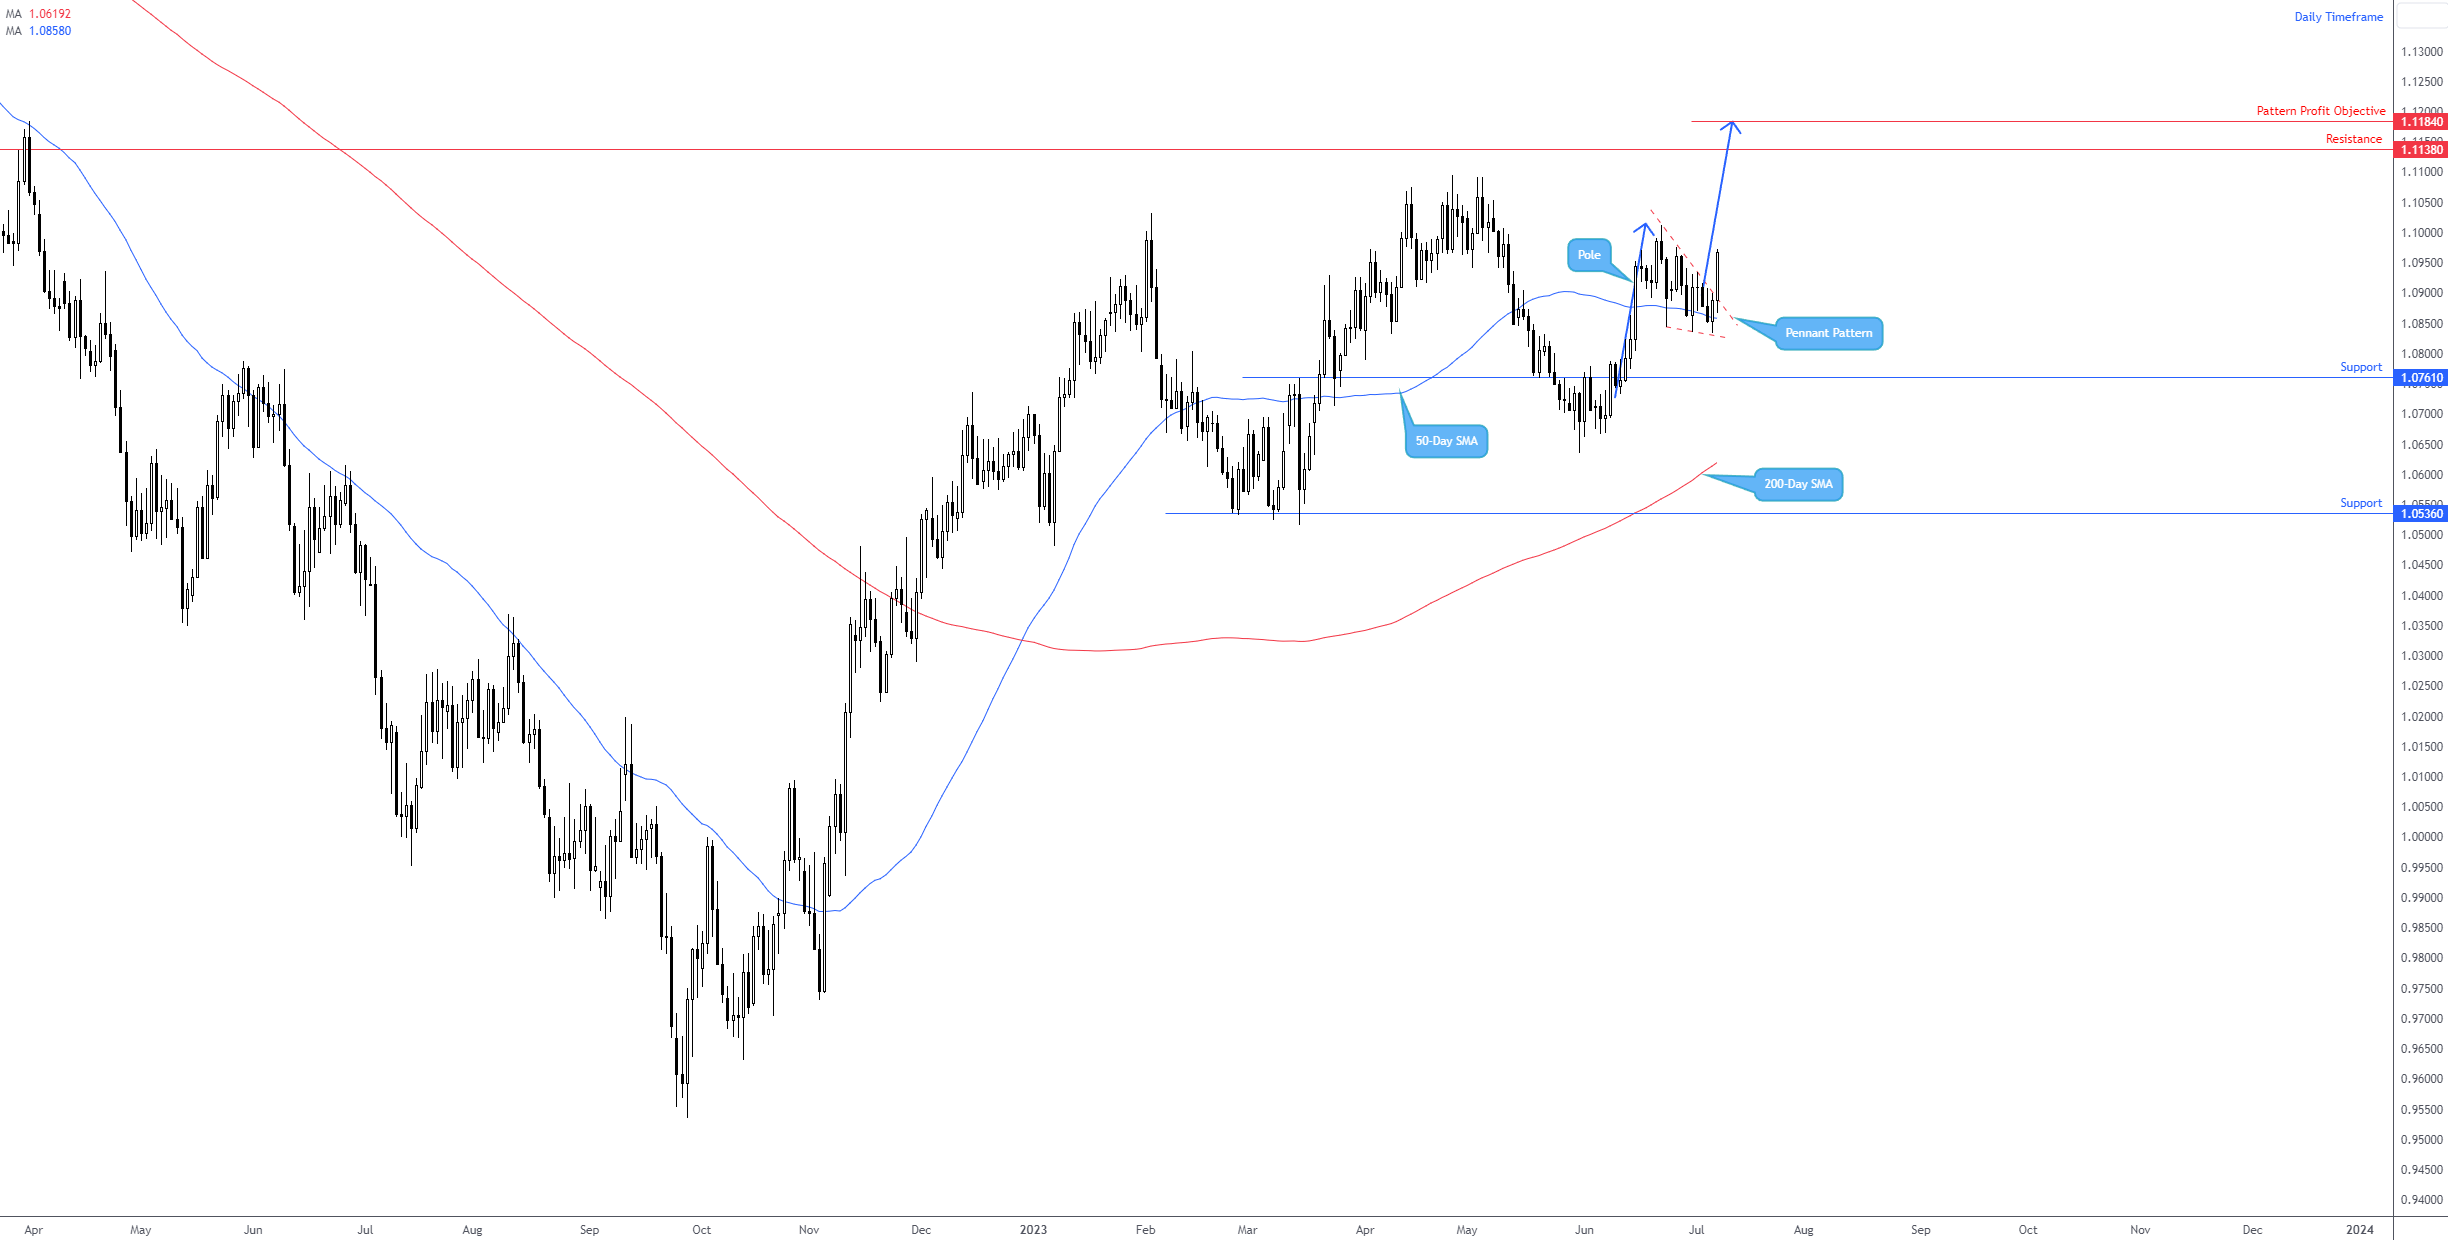 Commodities:
 Equities:
 Cryptocurrencies:
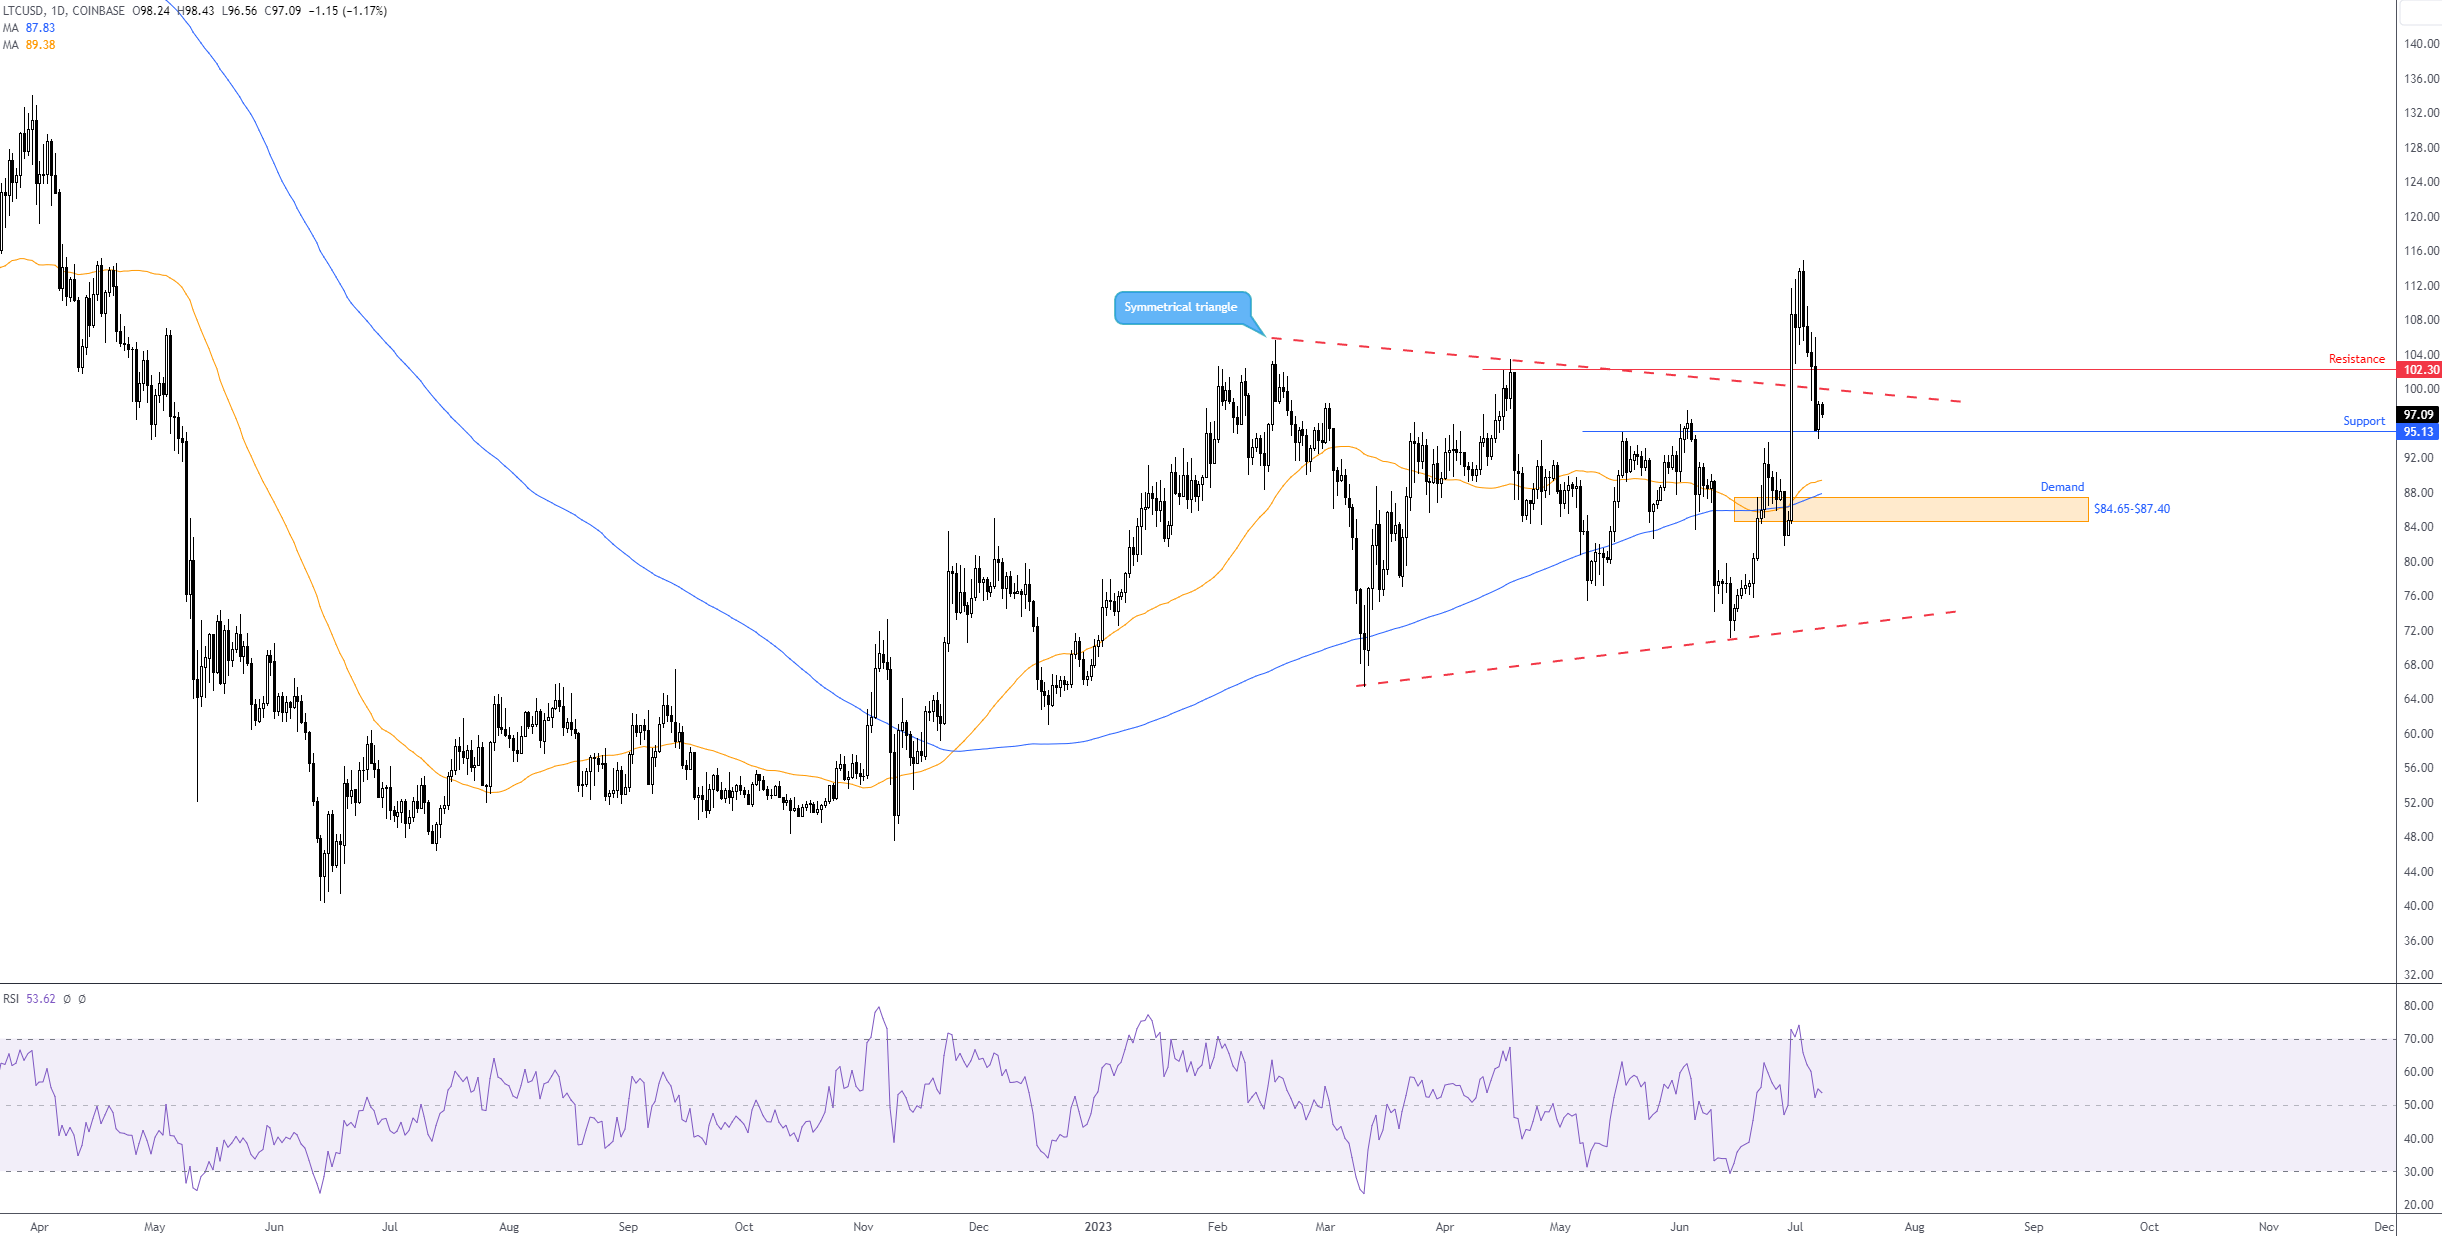 Charts: TradingView