This article was submitted by Michael Stark, market analyst at Exness.
Gold’s rally might be cut short
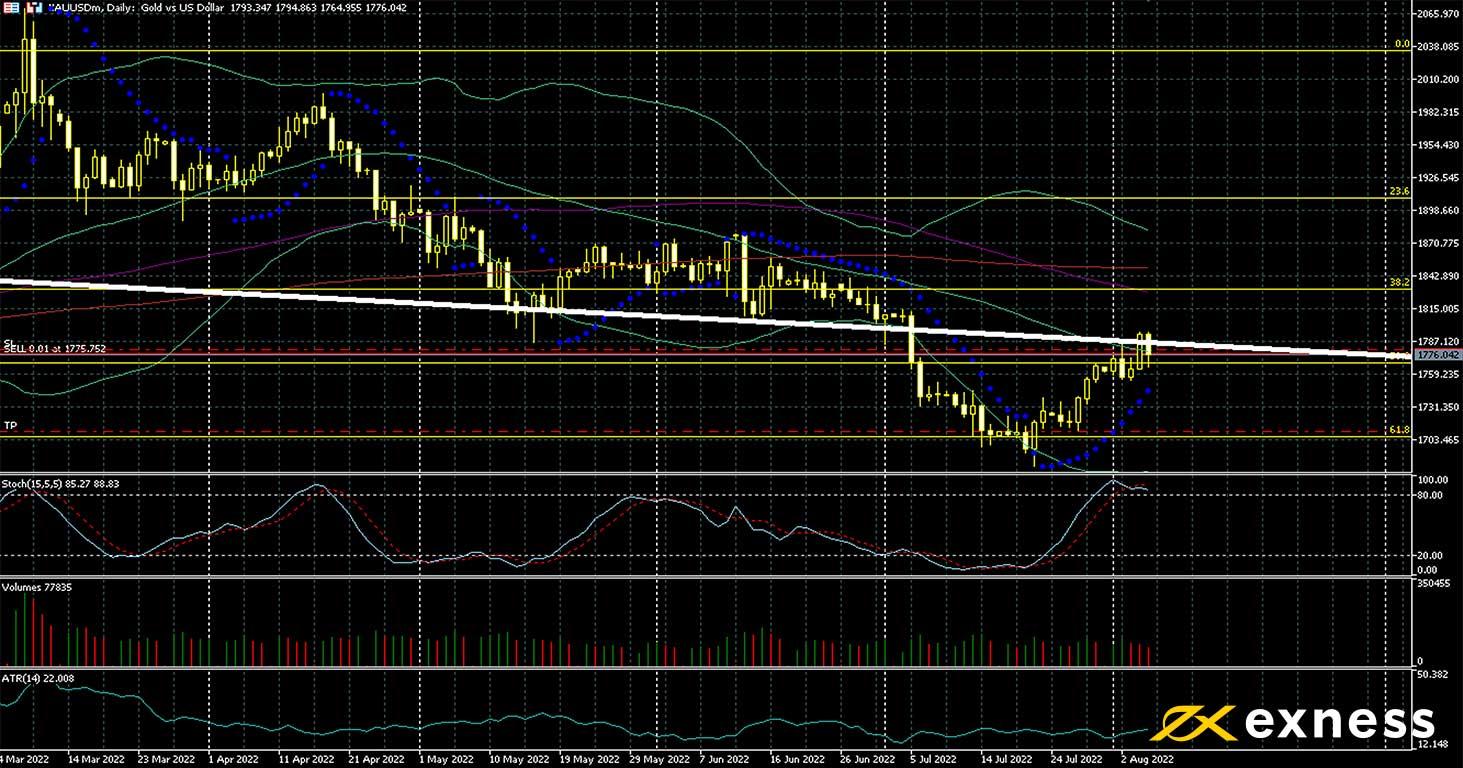
Gold against the US dollar (symbol ‘XAUUSD’) made a significant intraday loss on Friday 5 August after a stronger than expected job report from the USA and rising yields of decade Treasury bonds. The probability of a third successive triple hike by the Fed next month jumped to over 60% in the aftermath of the NFP.
‘That very strong job report for July seems to vindicate the Fed’s claim that the recession hasn’t necessarily arrived or at least won’t be a hard landing,’ said Michael Stark, an analyst at Exness: ‘All three of the main releases were better than expected, so that seems to encourage the Fed’s hawkishness, especially since further rising earnings could bring more upward pressure on inflation. The situation for gold seems pretty negative now as a result, but the latest inflation data from the USA on Wednesday 10 August are key.’
Gold tested the 50 SMA from Bands again though this time to the downside on 5 August with the slow stochastic in overbought. $1,700 seems to be too aggressive a target for sellers from here, and in general the relatively low volume and low ATR would also suggest short-term trading given the importance of 10 August’s US CPI. To the upside, the area slightly below $1,800 might establish itself as an important resistance.
Oil’s headwinds continue
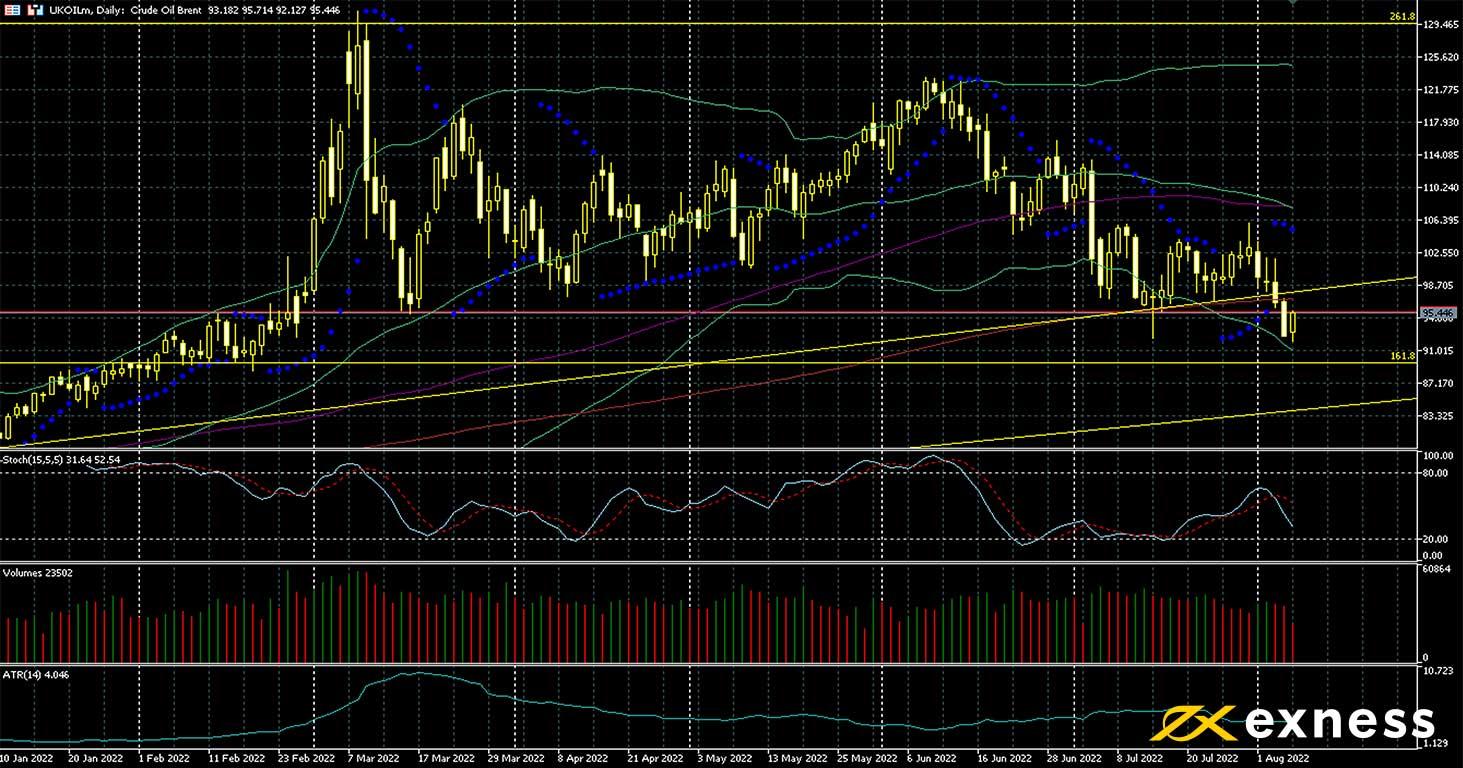
Brent Crude (symbol ‘UKOIL’) made losses in the first week of August, reaching around $95 and erasing all the gains after Russia’s latest invasion of Ukraine. The USA’s technical recession and signs of a general economic slowdown around the world have affected sentiment negatively, while there are some signs of increasing supply from Libya.
‘OPEC remains pretty confident it seems, still signalling very tight supply and with Saudi Arabia hiking prices for Asian buyers again,’ said Michael Stark at Exness, ‘But the focus now seems to be shifting to demand. American demand for petrol in July was significantly lower than the seasonal norm before Covid and supply from the USA has continued to increase slowly but fairly steadily this summer so far.’
The technical picture for Brent is generally quite negative, with the price now below all three of the 50, 100 and 200 daily moving averages and the 50 SMA from Bands in the process of death crossing the 100. Selling volume has dominated over the last few days. The 161.8% weekly Fibonacci extension seems to be an obvious support in the near term, but a longer term sell from here seems to be risky given that $100 and the 200 SMA are still not clearly broken to the downside and 4 August was the lowest close since February. Short-term trading might be in view here until momentum downward becomes clearer.
Disclaimer: opinions are personal to the author and do not reflect the opinions of Exness or LeapRate.
Experienced writer and journalist, working in the global online trading sector, Steffy is the Editor of LeapRate. She has previous experience as a copywriter and has been with the company since January 2020. Steffy has a British and American Studies degree from St. Kliment Ochridski University in Sofia.