This article was submitted by Antreas Themistokleous, market analyst at Exness.
The US Dollar started to depreciate against other major currencies in the last week especially against the Euro and the British pound. While the greenback is slightly depreciating the gold chart is also declining without any signs of reversal. This preview of weekly data looks at fiber (EURUSD) and gold (XAUUSD) ahead of a pretty packed economic news week with the key release on Friday, Non-farm payrolls.
The major change in monetary policy last week was the European Central bank’s triple hike of its bank rate to 2%. This is the first back-to-back hike in the EU for more than a decade, in an effort by the central bank to tackle rising inflation..
Overall, the focus among central banks remains on the Fed, with the sentiment on tightening having a strong effect on many markets. The Fed’s meeting this week is expected to create volatility in the markets with a triple hike being expected.
Manufacturing and non-manufacturing PMI is also expected to affect the USD pairs as well as unemployment rates and job openings figure. Quite a busy week for the buck with Friday being the ultimate day for this week on news release with the NFP being expected by the market to be around 200K.
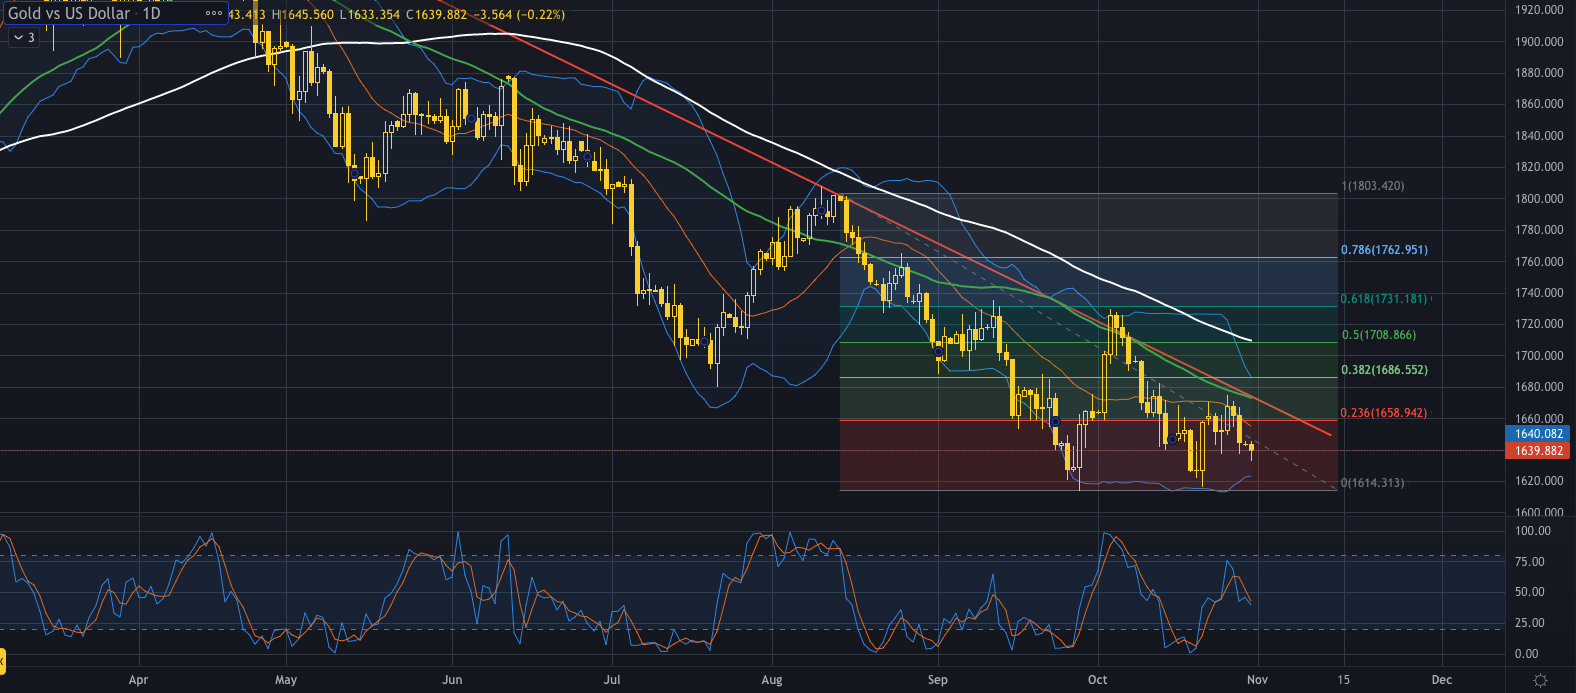
GOLD, daily
Gold is continuing its bearish momentum retesting the major trendline for another month currently trading around $1640 price area. The “yellow metal” found resistance on the 23.6% of the Fibonacci retracement level before resuming its declining momentum.
With no signs of reversal or corrections the most plausible scenario would be a continuation of the current trend at least in the short term. This is always dependent on the economic news related to the US Dollar which there is a lot coming this week. We can easily notice areas of possible resistance on the chart which are the Fibonacci levels of 23.6% at around $1660 price area which is also the trendline and the 50 day moving average. If the price continues its downward momentum we can expect a first point of support being around the $1620 price area which consists of the lower band of the Bollinger bands and the 0% of the Fibonacci.
With no signs of reversal or corrections the most plausible scenario would be a continuation of the current trend at least in the short term. This is always dependent on the economic news related to the US Dollar which there is a lot coming this week. We can easily notice areas of possible resistance on the chart which are the Fibonacci levels of 23.6% at around $1660 price area which is also the trendline and the 50 day moving average. If the price continues its downward momentum we can expect a first point of support being around the $1620 price area which consists of the lower band of the Bollinger bands and the 0% of the Fibonacci.
The main question mark this week is over Friday’s release – while gold might well bounce upward if the figure of 200K on the NFP is accurate, a higher than expected figure could lead to a retreat by the price at least in the short term.
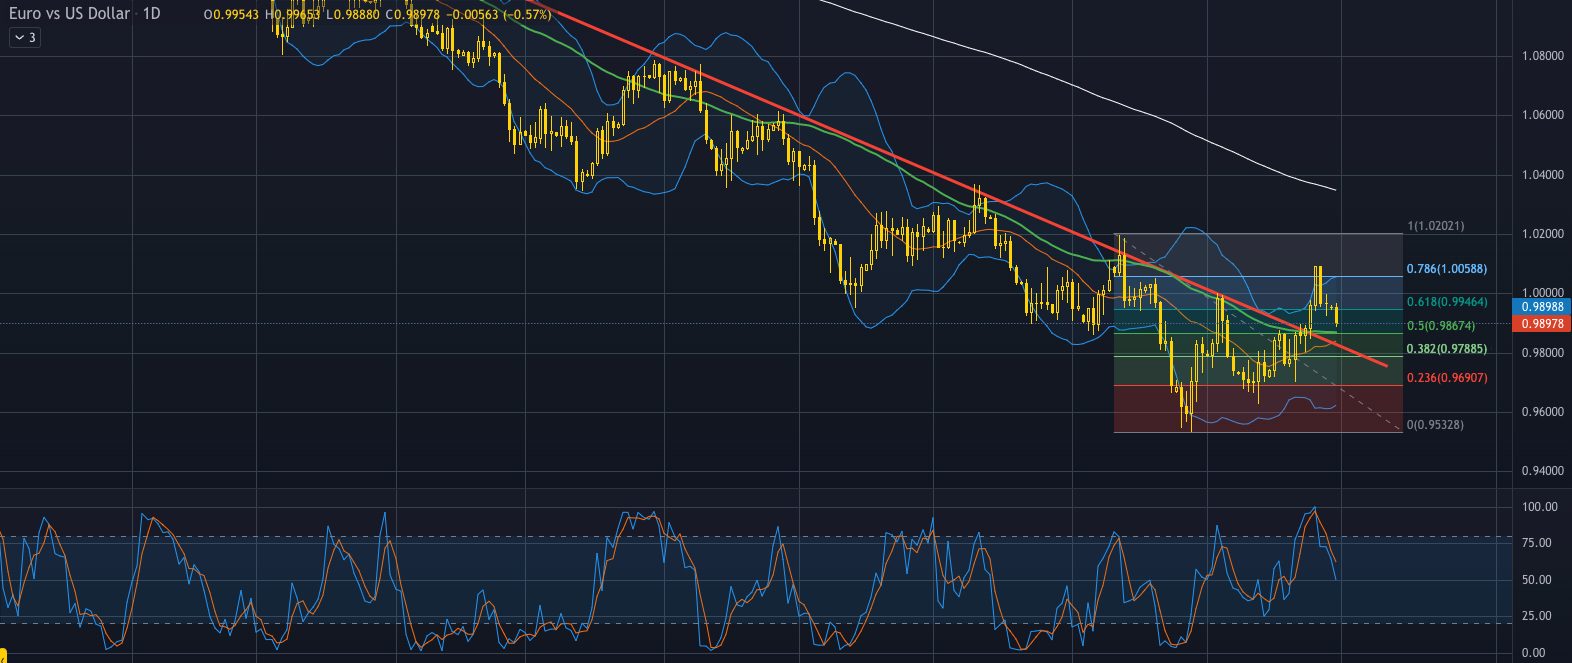
Fiber, daily
Fiber (EURUSD) has been mostly declining for the last ten months with the price finding support in late September at around the $0.95300 price area and rebounding to the upside until today. The price is currently trading around the $0.98800 area which consists of the 50% Fibonacci retracement level and also the 50 day moving average. The reversal/correction to the upside was strong, breaking through the resistance levels of the 50 day moving average, the major trendline which is in effect since February and the upper band of the Bollinger bands.
We can expect a strong support area at around the $0.97800 price area which is at the 38.2% of the Fibonacci and the major trendline. The Stochastic indicator is not showing any overbought levels so there are no signals that the upward movement is anywhere near the end. With the major publications throughout the week it is almost impossible to be a calm week for fiber. Important news is always on the trader’s radar with NFP, unemployment rates and PMI creating volatility in all the pairs related to the USD.
Risk/reward ratios and money management rules are what makes the difference between the winners and losers in such volatile times.
Disclaimer: opinions are personal to the author and do not reflect the opinions of Exness or LeapRate.
Experienced writer and journalist, working in the global online trading sector, Steffy is the Editor of LeapRate. She has previous experience as a copywriter and has been with the company since January 2020. Steffy has a British and American Studies degree from St. Kliment Ochridski University in Sofia.