
The following article was written by Jens Chrzanowski, Member of the Management Board of Admiral Markets Group AS.
Hello,

Jens Chrzanowski, Admiral Markets
Many traders make all of their trading decisions on a single time frame only. Other traders have stopped using multiple time frames after failing to implement the concept. My hope is that by the end of this article – most of which has been kindly written by our professional analyst, Chris Svorcik – you will know how and why many successful traders use multiple time frame (MTF) analysis to improve and optimise their discretionary trading decisions.
Chris’ analysis always takes into account three time frames. We will show you exactly how each time frame benefits his trading plan.
Learn the Best Time Frames
Which three time frames does he recommend?
The answer is surprisingly simple: all of them!
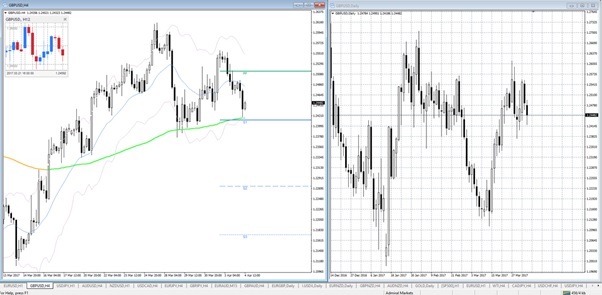
A MetaTrader 4 chart, featuring the Mini Charts add-on from Admiral Markets’ MetaTrader Supreme Edition
Keep in mind that the time frames have sufficient distance from each other. Chris does not consider using a 1, 2 and 3 minute charts as multiple time frame (MTF) analysis because these time frames are way too close to one another.
If you are using the MetaTrader 4 or MetaTrader 5 platform, the best tip is: always choose three relevant time frames with sufficient distance between them. And if you use the latest MetaTrader 5 version: don’t forget that all time frames are available, with no limits, as with MetaTrader 4. Especially M10, which many traders have waited a long time for.
Chris tends to use these time frame combinations:
- Swing trading: weekly, daily, 4 hour charts;
- Intra-day/week trading: daily, 4 hour, 1 hour charts;
- Intra-day trading: daily, 1 hour, 15 minute charts.
Long-term traders could use a monthly, weekly and daily (or 4 hour) chart combination. Scalpers could perhaps go with a 1 hour, 15 minute and 5 minute chart combination.
The bad news is, using multiple frame analysis requires more attention from you, as well as and time from you than single time analysis.
The good news is, there are methods to quickly perform MTF analysis (multi-time frame) by using special indicators – like the Mini Charts add-on – part of the the MetaTrader Supreme package.
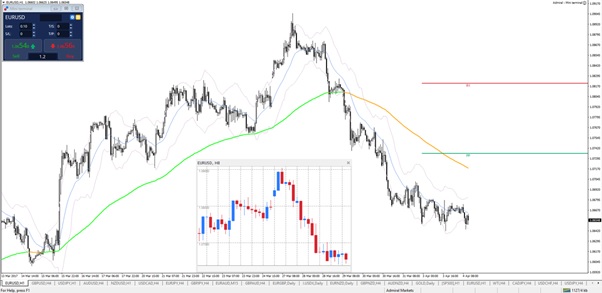
A Mini Chart, which can be used as an additional chart window in MT4 & MT5.
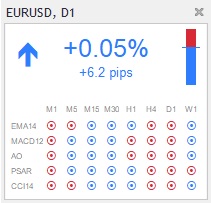
Symbol Information indicator add-on
Or, you could use another free MetaTrader Supreme indicator: Symbol Information. This one, specifically designed for the more advanced technical analysis trader, shows the most important signals from the most used indicators at a glance, in different time frames.
As you can see, the daily range, the general trend and the daily change in percentage and pips can also be viewed here, at a glance.
Benefit of the Highest Time Frame
The highest time frames are primarily used for spotting support and resistance (S&R) levels. Chris identifies S&R as tops and bottoms, fractals, Fibonacci retracement and target levels as well as Admiral Keltner bands.
The price could either be at, or close to, the S&R level – a ‘decision zone’ as he calls it. It can also be in the middle part, in-between S&R levels:
- The price is at a key level: either a breakout or a bounce will occur.
- The price is in the middle: either a continuation or a pullback will occur.
If the price is at a key level, Chris will monitor the reaction of the candles and price action to see if a breakout or a bounce is more likely to occur.
Warning: this is when he wants to avoid going long right into resistance or short into support. Also, if the price does break out, he wants to keep an eye on a strong breakout candle to avoid false breaks.
If the price is in the middle of the zone, Chris will typically look at one time frame lower to see how strong the trend is and whether a continuation towards the next S&R or a retracement back to the previous S&R is more likely.
Benefit of the Middle Time Frame
The middle time frames are the best for viewing trend, momentum, correction, and patterns in general. This is where Chris looks for trend channels, the position of price versus moving averages, how momentum (impulse) and correction are behaving, divergence patterns, and whether any chart patterns indicate reversal, continuation, or range.
His main purpose is to assess the following:
- Is there a trend?
- Is there impulsive or corrective price action?
- Are there signs of exhaustion like divergence or reversal patterns?
- Are there signs of continuation patterns?
Most of the time, Chris is looking for a trending chart, but not everyone needs to trade the same way. He prefers trends more than ranges or reversals, so he is always analysing whether the price will do one of the following things:
- Immediately continue → interested in breakout;
- Build a retracement → interested in trading the bounce;
- Reverse → mostly not interested with some exceptions.
Benefit of the Lowest Time Frame
The middle time frames are the best for finding the entry and taking a trade setup. This is the best trigger chart and it is useful for trading purposes.
Depending on analysis from the higher and middle times, Chris will typically look for one of the following:
- Breakout of a trend line;
- Break of a chart pattern;
- Bounce at a Fibonacci level;
- Bounce at moving average;
- His time factor pattern.
In most cases, Chris uses candlestick patterns to confirm his entry point. For instance, with bounce setups, he will wait for a wick or exhaustion candle. With breakout setups, he will wait for strong candle closes.
Sometimes, Chris exaggerates in finding a precise and ‘fancy’ entry, so at times, he also sets up pending orders. However, his confidence level in the setup has to be higher.
This weekly article gives us an insight into Chris Svorick’s trading style. But I would also like to quote another great trader of Admiral Markets’ global family, Jochen Schmidt. His trading style is “price action trading”, and he always tells his audience never to lose the big picture. Even if you do short-term trading and plan to hold an open position for just 20 minutes – know the bigger time frames, the bigger trend, the big picture.
See you next week!
Do you have any feedback, concerns, requests, maybe even compliments? I’d love to hear them. Please contact me via: [email protected]
Trading on margin carries a high level of risk, and this article should not be seen as advice or solicitation to buy or sell, but written for informational purposes.