
Following the Bitfinex/Tether alleged scandal and the sudden unexpected downdraft in crypto valuations, analysts have taken on a decided air of cautious optimism before venturing out on any unsure limbs in Bitcoin’s future. A few brave souls have reiterated their previous predictions, and there does seem to be consensus that BTC will pass the $6,200 threshold sometime soon, but the use of short-term caveats seem to be in vogue at the moment.
While some forecasters ponder how high Bitcoin might go in the next one or two years, the vast majority of the crypto community seems obsessed with finding that one special chart, often referred to as the “Holy Grail”, that will reveal with surety what will transpire in the month of May and beyond. Technical analysis attempts to see repeating patterns, to gauge investor sentiment, and to extrapolate forward predictions, but it is only based on previous pricing behavior, yet the belief is that some pattern embedded in some chart will ring true and produce the “golden ring”. A number of analysts have suddenly chosen to believe in the MACD indicator at this time.
MACD is short for “Moving Average Convergence Divergence”. It is a member of the oscillator family, which includes several indicators that were designed to provide signals regarding overbought and oversold conditions. The MACD comprises two smoothed exponential moving averages that oscillate about a “zero” mean, the point where the two averages are equivalent. The “Histogram” version presents the differences in a bar chart type depiction, which to many is more visually pleasing. It is shown below:
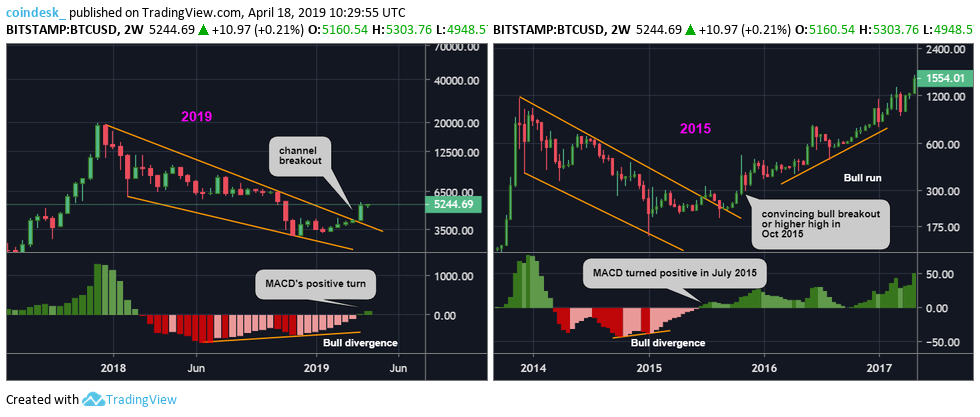
This 2-week version of the chart, courtesy of TradingView, has struck many a “chord” in the analyst community. The accompanying narrative notes the almost eerie resemblance to the same conditions that existed in 2015, when the MACD turned to “Green”, and the Bitcoin market value began its long parabolic rise to stardom. A few weeks back, this indicator turned positive for the first time since February of 2018, with similar bull divergences occurring beforehand, as shown.
Before you rush to your computers to go long Bitcoin, there are a few considerations you might want to take into account. The MACD is a lagging indicator, built upon moving averages of previous price behavior. It lags the market and may have turned positive, based solely on the recent rally, nothing more. Experienced traders have also learned never to trust the signal from a single indicator. They always attempt to find confirmation from another indicator, a pattern, or line analysis, and then make their own judgment.
Per one analyst:
The indicator, therefore, tends to lag the price and has limited predictive abilities. Further, the longer the time frame, bigger is the lag. As a result, many would consider the bullish turn a result of the recent price rally rather than an advance warning of further gains. It, however, gains credibility if we take into account the historical data, which shows the last positive crossover on the MACD, seen in July 2015, was followed by a 2.5-year-long bull market.
Several analysts are buying into the message that the MACD Histogram on this chart is broadcasting – a major bull run is on the way. The near-term prognosis, however, is unclear. Other analysts of this “MACD bent” have also looked at hourly and daily charts, but the messages there are not as convincing. One analyst followed both the MACD and the “Relative Strength Index” or “RSI” and senses an imminent pullback before any upward thrust: “On the hourly chart, the RSI continues to produce lower highs in favor of the bears, as opposed to higher highs, while the MACD has turned negative.”
In summary, the longer termed MACD seems bullish, but the short-termed version seems to suggest that a consolidation is due. What to believe? Technical analyses, at best, are guesstimates with probabilities attached. Yes, the odds would seem to favor prosperity ahead, but the opposite could happen, too. At the end of the day, you must use your best judgment, then make your own investment decisions.