This article was submitted by Antreas Themistokleous, market analyst at Exness.
This preview of weekly data looks at GBPUSD and USOIL, where economic data coming up later this week are the main drivers in the markets for the near short term outlook.
The most important economic data for this week are:
Canadian inflation on Tuesday at 12:30 PM GMT. The market is expecting the inflation rate for the month of June to continue its declining trend and reach 3% compared to the previous 3.4%. If confirmed this would be the lowest figure for the year and could influence the bank of Canada to get more dovish on their next meeting , creating some minor losses for the loonie.
UK inflation rate on Wednesday at 06:00 AM GMT. The expectations are for a decline around 0.5% reaching 8.2% which would be a yearly low , if confirmed. British inflation has proven to be more sticky than expected with only going back to single digits as recent as April. This could have some effects on the monetary policy by the Bank of England but possibly only minor oes since inflation is still pretty high compared to the European and American figures.
Japanese balance of trade on Wednesday at 11:50 PM GMT. Balance of trade is expected to improve massively for the month of June reaching a deficit of ¥-46.7B compared to the previous ¥-1372.5B.
Japanese inflation rate on Thursday at 11:30 PM GMT. Inflation rate is expected to increase by 0.3% reaching 3.5% for the month of June which could support the yen in the short term since it could influence a more hawkish stance by the bank of Japan when it comes to their monetary policy.
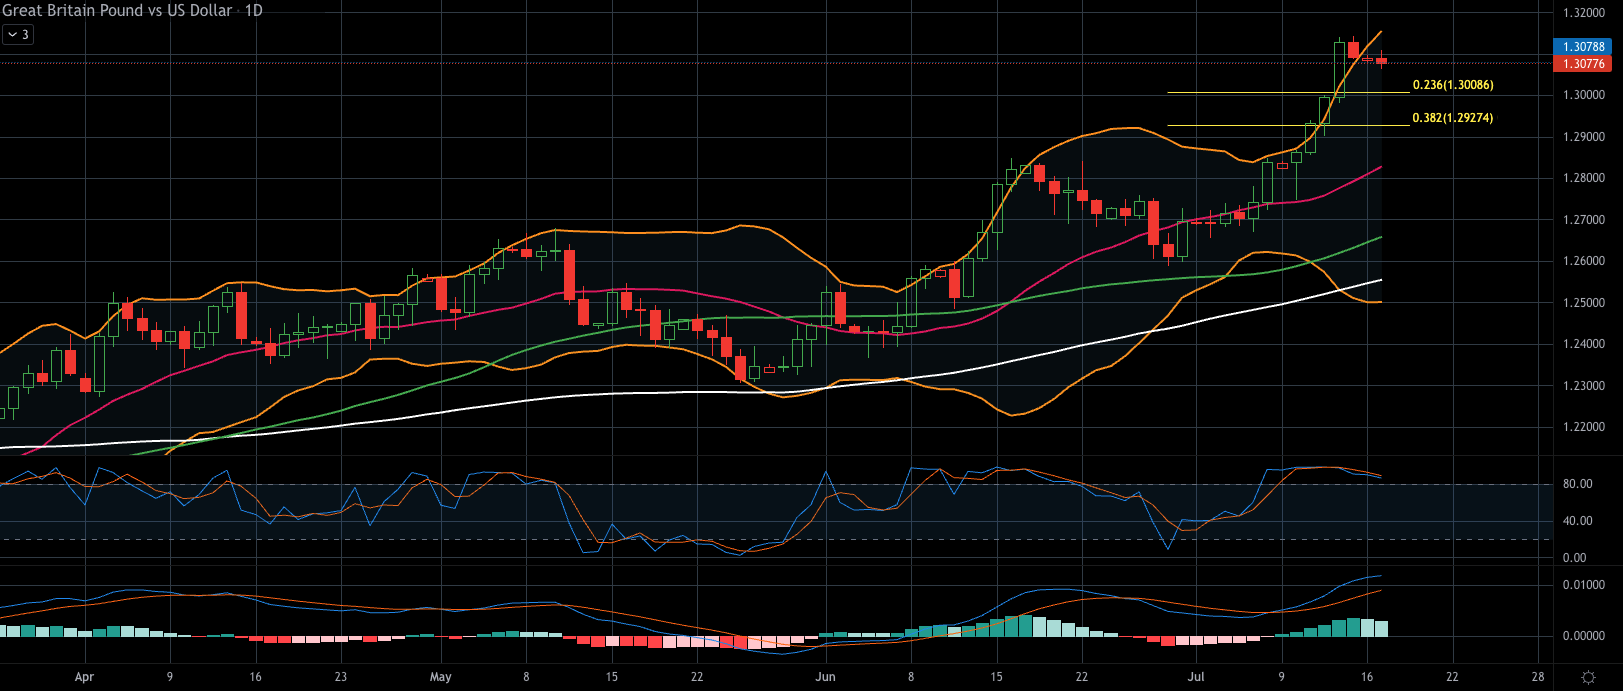
GBPUSD, daily
The recent bullish revival in the pair is attributed to a significant selloff in the USD shown in the Dollar index (DXY) following positive inflation data in the US. However, the upcoming UK inflation data adds complexity to the short to medium term outlook for the pair. Despite the Bank of England’s hawkish stance, UK core inflation has been accelerating, putting pressure on Governor Andrew Bailey’s prediction of a sharp fall in inflation from Q2 onwards. This did not happen yet instead price pressures have gained momentum offering support to the British quid.
On the technical side, the price on the chart is currently in a correction status after reaching a yearly high of around $1.31. The Stochastic oscillator is in the extreme overbought levels for the last 10 sessions indicating that a correction to the downside might still have some more power into it. On the other hand though the MACD indicator is showing a cross of the MACD line above its signal line possibly signaling that the buying power might still be valid to follow. The bullish narrative is also confirmed by the fact that the faster 50 day simple moving average is trading above the slower 100 day SMA showing that the overall bullish trend has yet to confirm a reversal .
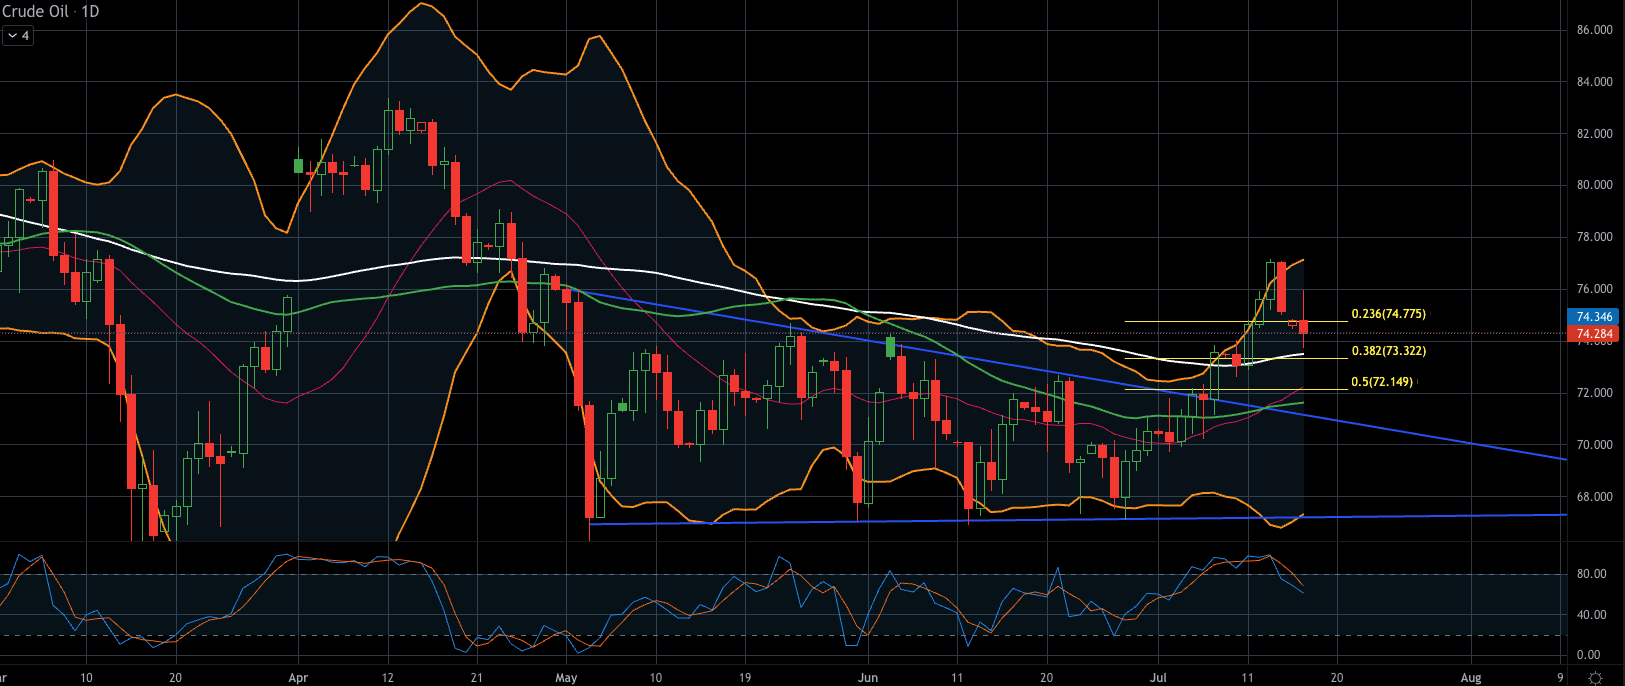
Oil prices dropped by over 1% on Monday due to slower than expected Chinese economic growth and the partial restart of halted Libyan output. China’s GDP grew 6.3% in the second quarter, below market expectations of 7.3%, leading to concerns about weakening demand from one of the world’s top oil importing countries. The resumption of output at two Libyan fields that were shut last week also contributed to the drop in oil prices. Additionally, Russian oil exports from western ports are expected to fall next month as part of supply cuts in line with Saudi Arabia.
From a technical standpoint, the price is in a correcting phase after the aggressive rally since late June that pushed the price of the “black gold” to break the triangle formation that was in effect for the last 2 months. The faster moving averages are trading well below the slower ones validating the long term bearish movement in the market despite the recent rally to the upside. The Stochastic oscillator is near the extreme overbought levels even though it seems to be moving down at the time of this report. The Bollinger bands have expanded showing that volatility in the market is fueled up while at the same time the $73 price area is considered a strong technical support area consisting of the 38.2% of the daily Fibonacci retracement level, the 100 day moving average as well as the psychological support of the round number.
Experienced writer and journalist, working in the global online trading sector, Steffy is the Editor of LeapRate. She has previous experience as a copywriter and has been with the company since January 2020. Steffy has a British and American Studies degree from St. Kliment Ochridski University in Sofia.