Weekly data: GBPUSD & USOIL price action

This article was submitted by Antreas Themistokleous, market analyst at Exness.


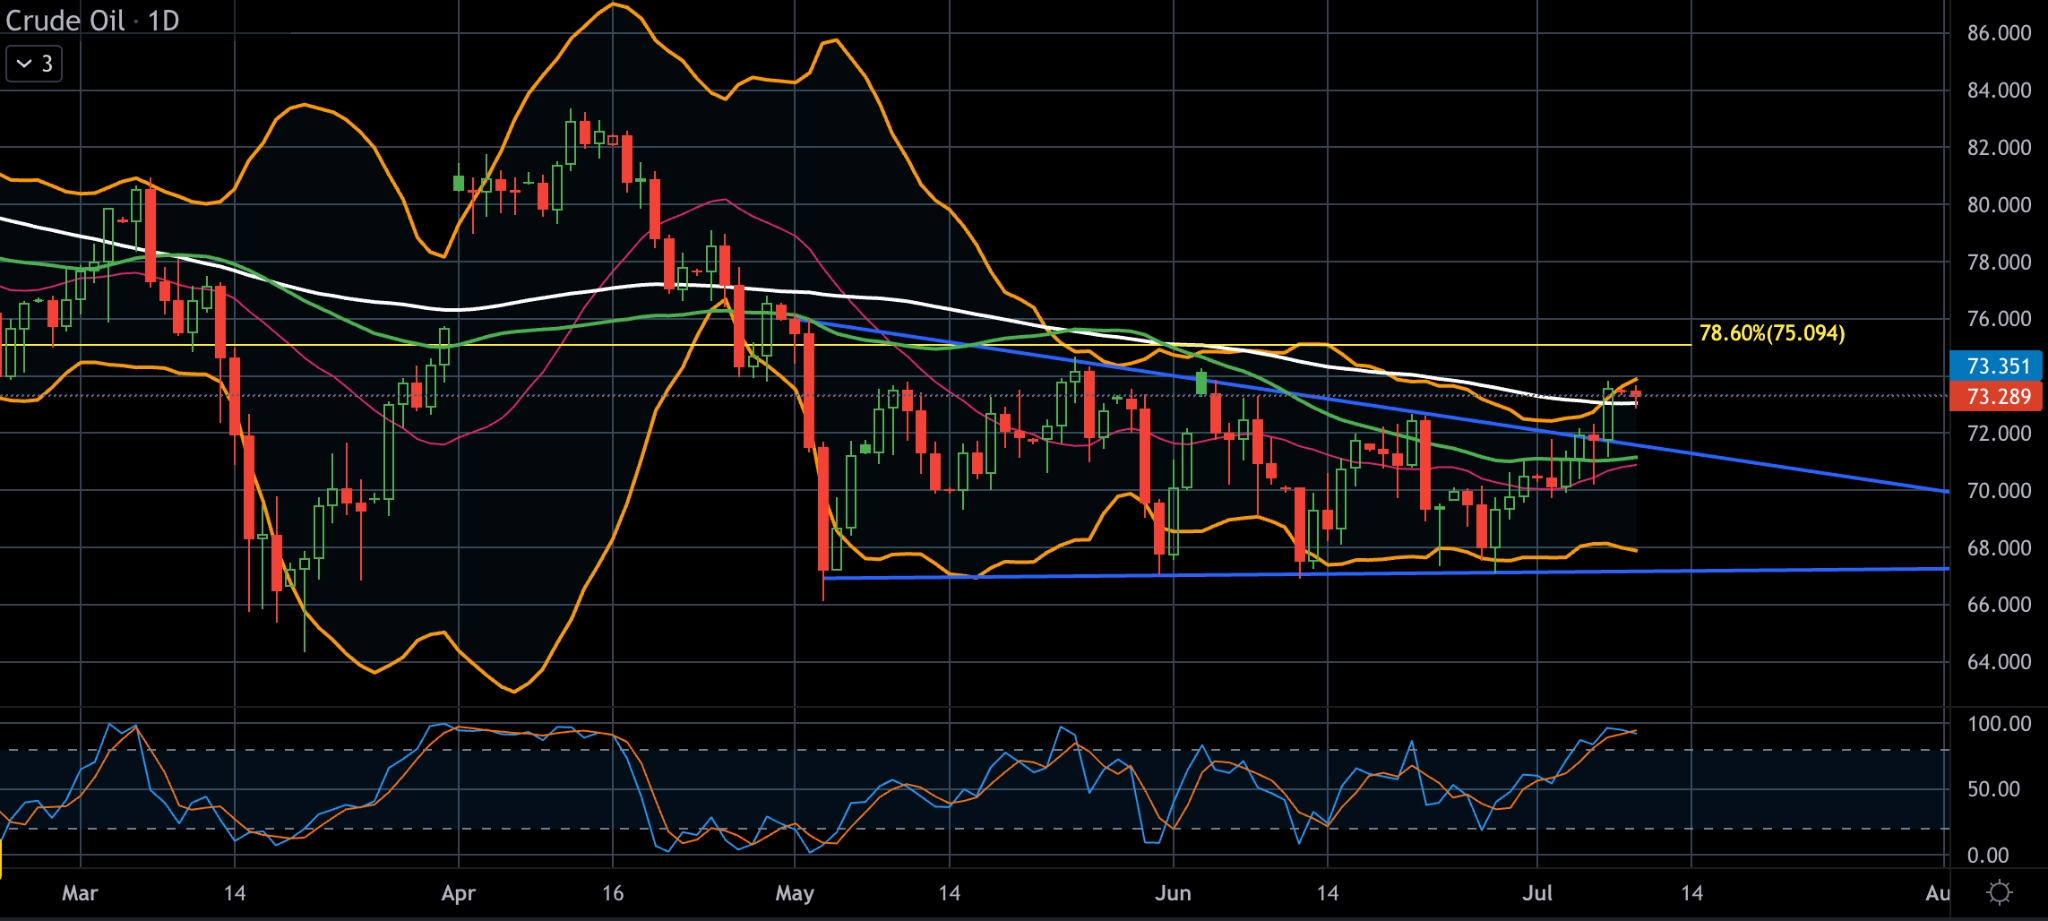
This preview of weekly data looks at GBPUSD & USOIL, where economic data coming up later this week are the main drivers in the markets for the near short term outlook.

The most important economic data for this week are:

  1. British unemployment & Claimant count change on Tuesday at 06:00 AM GMT. The market is expecting the unemployment rate for the month of May to remain stable at 3.8% while unemployment benefits claims to also decline by another 22,000 in June.
  2. US inflation rate on Wednesday at 12:30 PM GMT. Both core and non-core inflation figures are expected to decline by 0.3% and 0.9% respectively. If this data is confirmed we might see the probabilities of a further interest hike on the Fed’s next meeting decline on the Fedwatch tool since the year over year figure of the non core inflation would be closer to the Fed’s target rate of 2%.
  3. BoC Interest rate decision on Wednesday at 2:00 PM GMT. The Bank will publish its next full outlook for the economy and inflation, including risks to the projection, in the Monetary Policy Report at the same time. The expectation is that the central bank will proceed with a single hike pushing the rates to 5%. If this is confirmed we might see some short term gains for the loonie against its pairs.
  4. Monthly British GDP on Thursday at 06:00 AM GMT. The expectations are for a decline of around 0.6% reaching the negative figure of -0.4%. If this comes to be true then the British quid might experience some minor losses in the short term, if any at all.
  5. Monthly US PPI on Thursday at 12:30 PM GMT. Producer price index is expected to rise by 0.5% which could affect the next inflation publication to increase also. When PPI increases means that costs are rising for the producers which could be rolled over to consumers resulting in increased inflation.

GBPUSD, daily

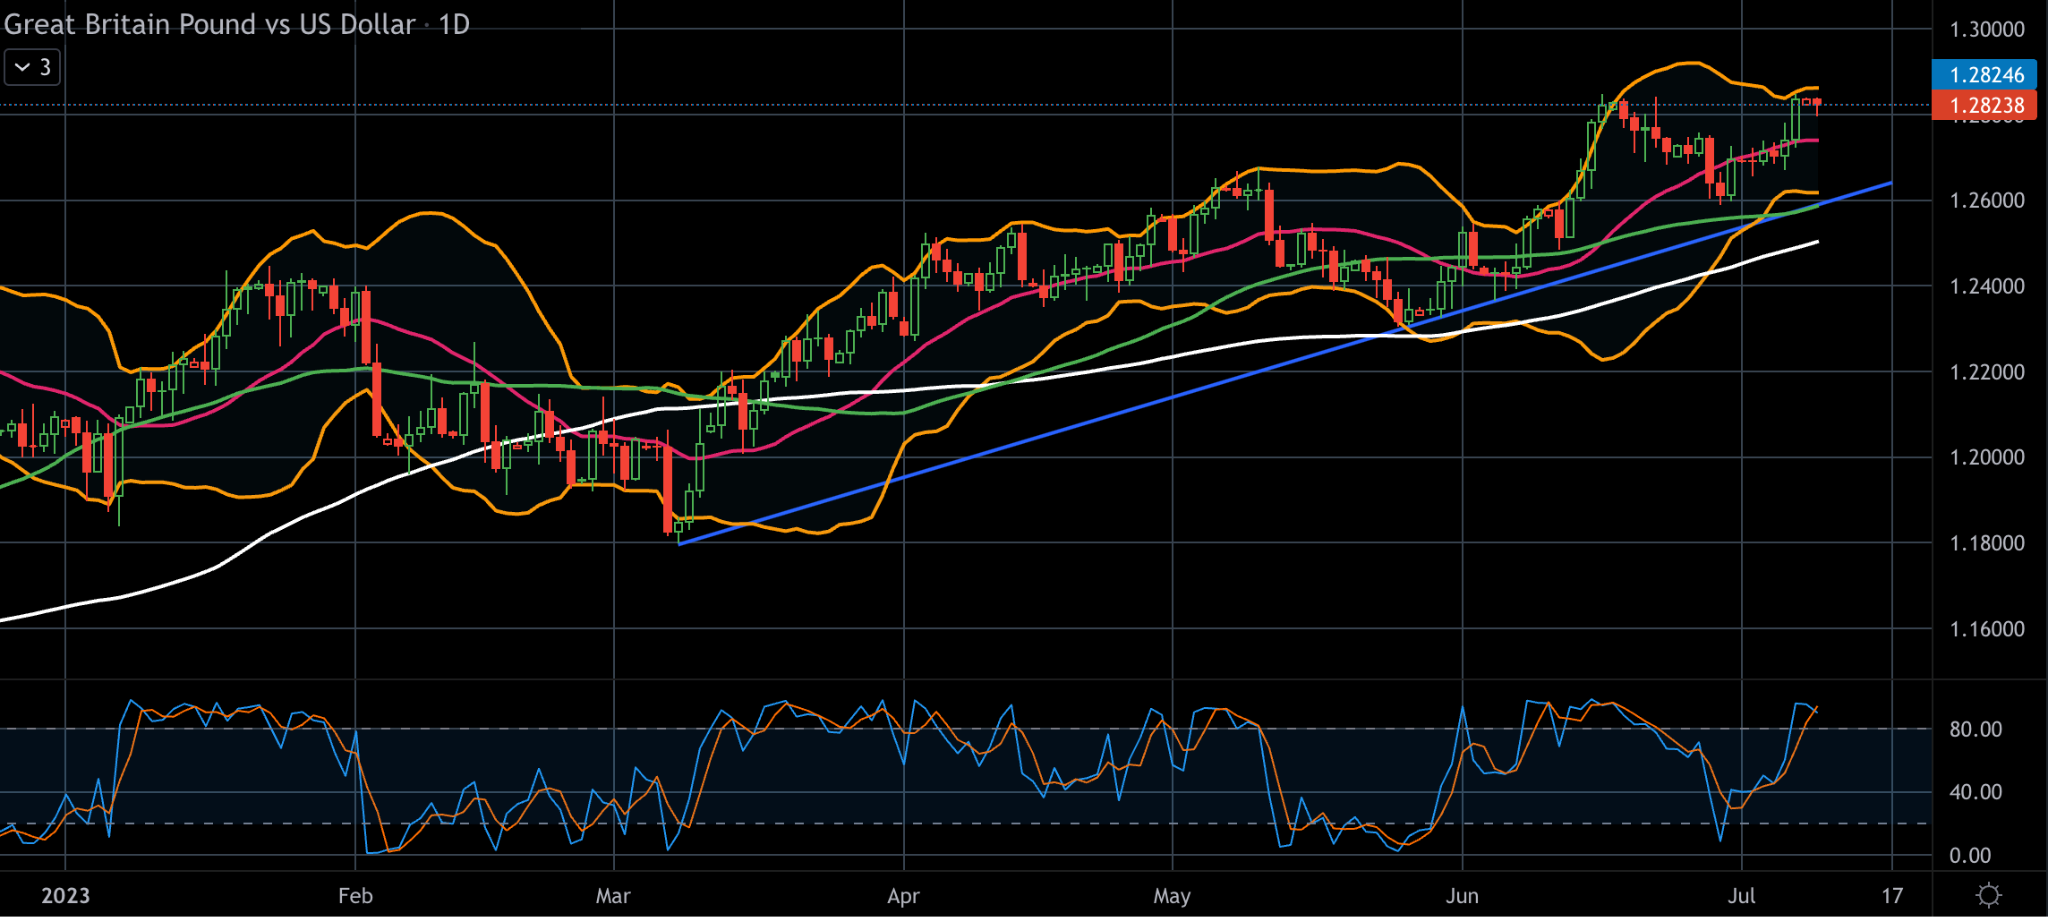
The negative Claimant change which is expected by market participants as well as the stable unemployment figure are possibly expected to support the quid against its pairs including the US Dollar.  Also if we take a look at the British 30 year gilt we will see that the percentage of 4,715% is near the yearly high of almost 5% while the corresponding American 30 year treasury bond yields are currently at 4,064%. This means that capital is flowing more aggressively in favor of the British pound compared to the US dollar which supports the narrative of bullish action on the cable chart.

On the technical side, the price on the chart has been making consistent gains since early March with multiple retests to break the upward trendline without being able to do so. This shows the strength of the quid against the dollar in the medium outlook. The 50 day moving average is still trading bove the 100 day moving average further validating the bullish momentum in the market while at the same time the Stochastic oscillator is in the extreme overbought levels indicating that we might see some minor correction in the market in the near short term but apart from this there are no clear signs of a trend reversal just yet.

All in all the area of $1.26 is the first major technical support level which consists of the 50 day moving average, the lower band of the Bollinger bands, the bullish trendline and also the psychological support of the round number. On the other hand the level of $1.30 is a technical resistance area consisting of the psychological resistance of the round number as well as an area of price reaction in mid April 2022.

USOIL, daily

Oil prices dipped  on Monday as investors awaited economic data from the United States. The oil market remains uncertain due to fears of demand control by Western economies and supply-control strategies employed by OPEC. Saudi Arabia and Russia have extended their supply cuts, easing the oil glut. JPMorgan analysts suggest that OPEC+ needs to deepen its cuts and extend them into 2024. In the U.S., strong wage growth and a further drop in the unemployment rate will likely lead the Federal Reserve to raise interest rates. U.S. oil rigs also fell to the lowest level since April 2022.

From a technical standpoint, the price has broken above its recent triangle formation which was valid for the last 2 months. Currently the price is facing resistance by the upper band of the Bollinger bands as well as the 100 day moving average. The Stochastic oscillator is recording extreme overbought levels because of the recent bullish rally of the last 2 weeks but the 50 day moving average is still trading below the 100 day moving average showing that the overall bearish trend hasn’t shifted yet. According to the Fibonacci levels the area of $75 is a strong technical resistance level since it coexists with the 78.6% of the weekly Fibonacci retracement.

Last week’s weekly data preview looked at USOIL & Gold price action


Disclaimer: opinions are personal to the author and do not reflect the opinions of Exness or LeapRate.

Read Also: