This article was submitted by Antreas Themistokleous, market analyst at Exness.
This preview of weekly data looks at GBPUSD and USOIL, where economic data coming up later this week are the main drivers in the markets for the near short term outlook.
The most important economic data for this week is:
Chinese industrial production tomorrow at 02:00 AM GMT. The market expectations are for a staggering 10.9% increase compared to 3.9% of the previous reading. If this is confirmed we might see some exponential increase on the price of production related commodities like oil & silver.
British claimant count changes tomorrow at 06:00 AM GMT. The previous release was positive 28,200 while market expectations for the upcoming publication is for a decline to reach negative 15,000. That situation would be positive for the pound and the FTSE 100, whereas if unexpectedly the number of claimants increases or the number of positive claimants is higher than the previous release, we might expect the pound and the FTSE 100 to make some losses.
Canadian Inflation rate tomorrow at 12:30 PM GMT. Market consensus is for a decline to 4.1% against a previous recording of 4.3%. If the consensus is confirmed then we might see some losses on the loonie against its pairs, since it could influence a more dovish stance by the Bank of Canada on their next meeting.
Japanese Inflation Rate on Tuesday at 23:30 GMT. The expectations are that there will be no change in the inflation figure, however, if the release comes in higher than the expectations, it might encourage the yen to bounce whereas if inflation is lower than expected, we might expect the yen to make further losses.
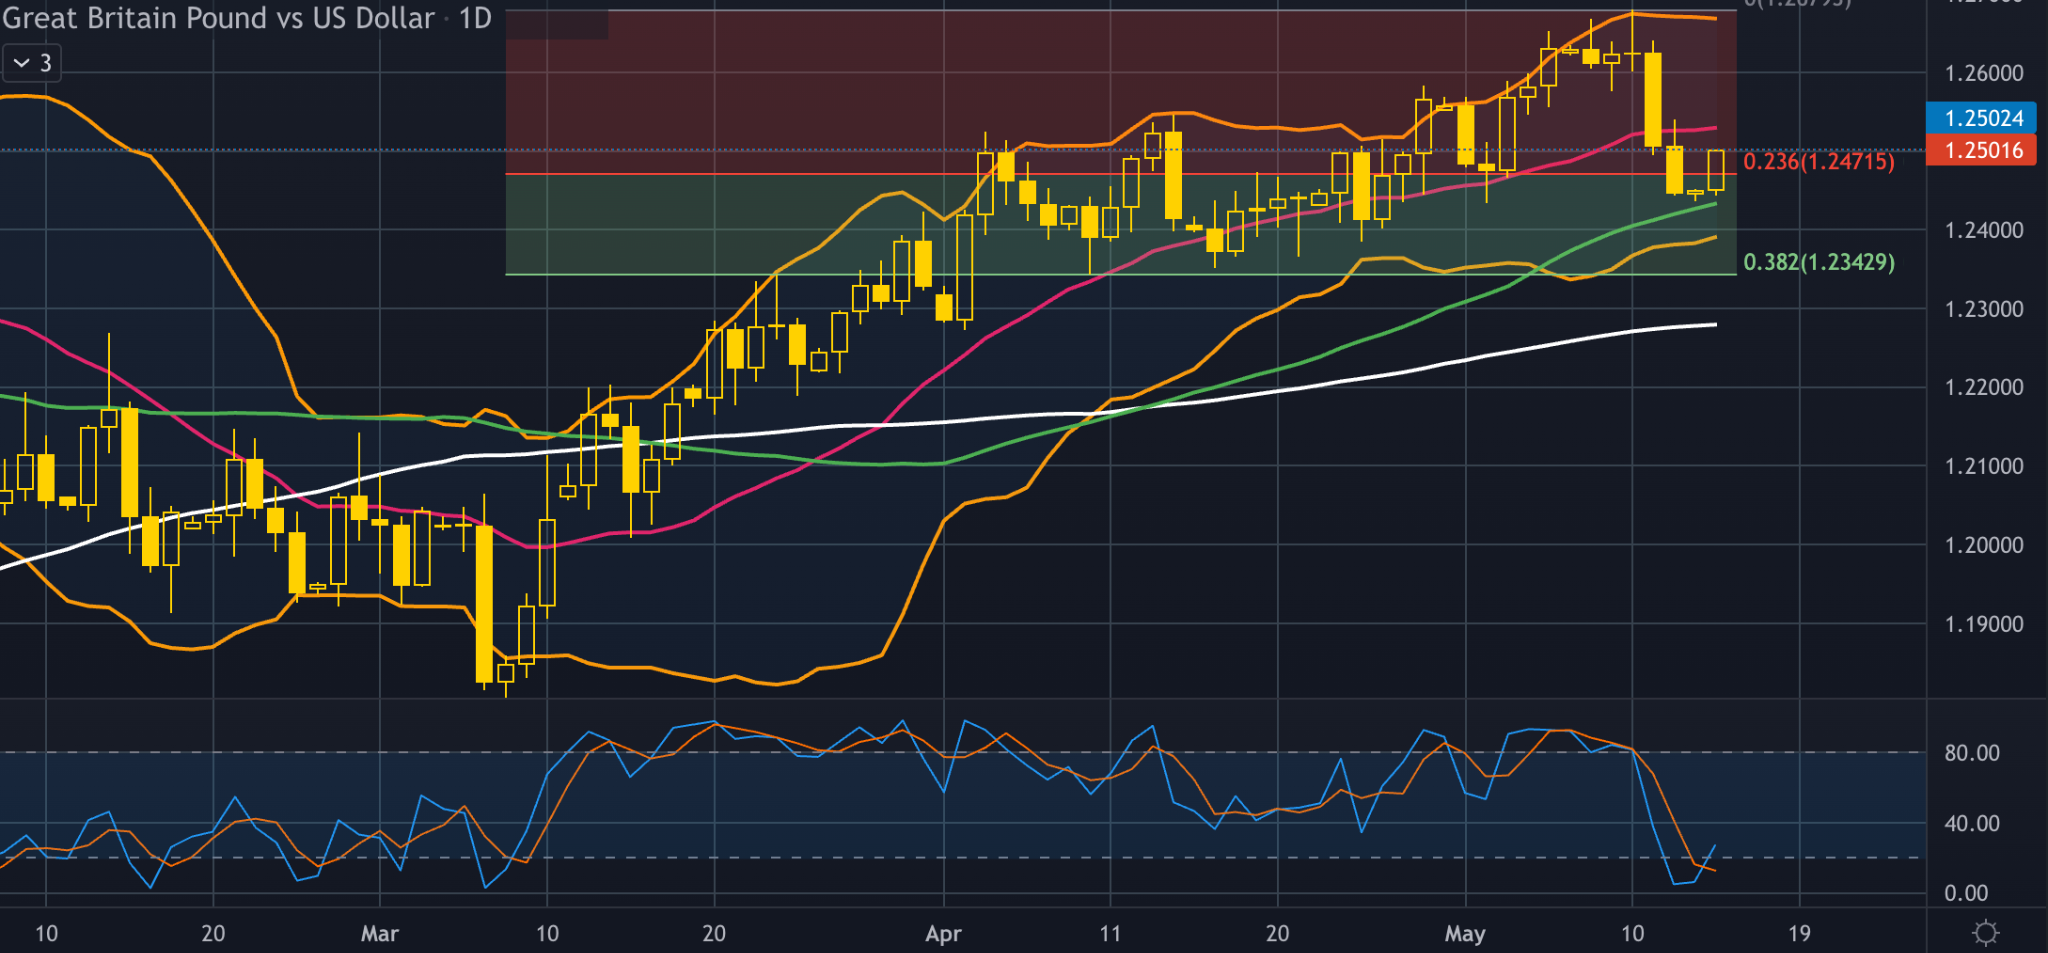
GBPUSD, daily
This will likely be a busy week for the cable pair, with economic data coming up later in the week about the British job report being the main economic event that would create volatility on the pair. Last week’s data on US inflation and British GDP growth created a correction on the daily chart, creating losses for the quid of around 2%. A decline in the Claimants could support the British pound against its pairs at least in the short term, making the scenario of a continuation to the overall bullish momentum a very possible one.
On the technical side, the price on the cable chart has found resistance on the upper band of the Bollinger bands and has since corrected to the downside, with today’s candlestick ticking to the upside at the time of this report. The 50 SMA has crossed is still trading well above the 100 SMA, indicating the bull movement is still strong, while the Stochastic oscillator is near its extreme oversold level, further supporting the narrative of the bullish movement still in effect. Today’s session is rather important to see where it will close, since it is trading exactly on the 23.6% of the daily Fibonacci retracement level so a close above the current level could indicate the continuation to the upside. On the other hand, if we see further corrections to the downside we might expect some support around the $1,24 price area which consists of the psychological support of the round number, the 50 day moving average & the lower band of the Bollinger bands.
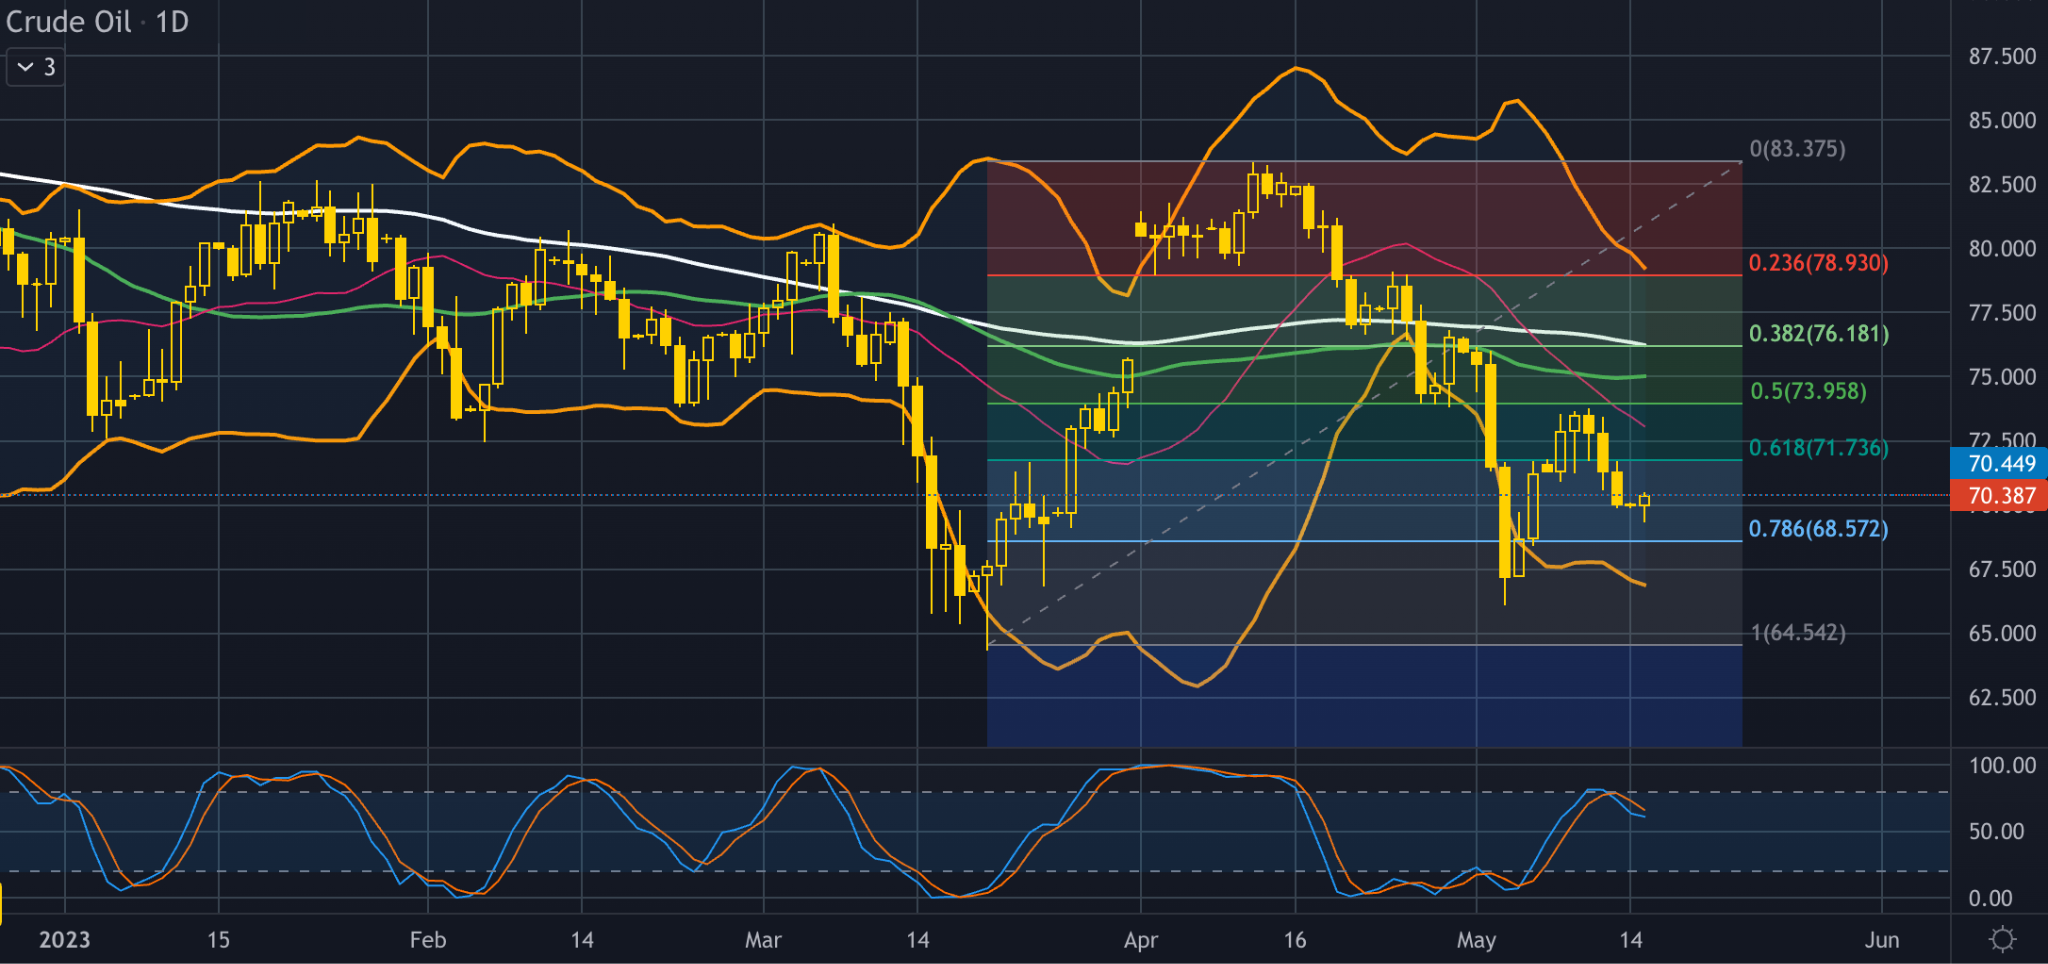
The price of oil edged up as optimism about tightening supplies from OPEC and its allies supported crude prices. The supply reduction from OPEC that was planned to start in May is one of the main factors contributing to the price pump that we witnessed in early May for the “black gold”. Recession fears reignited for the US economy, since talks over the U.S. government’s debt ceiling were postponed and concern is growing over another crisis-hit regional bank, which also helped boost the price of crude oil in the short term outlook. U.S. energy secretary Jennifer Granholm signaled that the country could repurchase oil for the Strategic Petroleum Reserve (SPR) after completing a congressionally mandated sale next month , meaning higher demand from the world’s top oil consumer which could result in pushing the price to the upside.
From a technical standpoint, the price is in an overall bearish movement for the last month with a minor correction happening in early May. The 50 day moving average is trading below the 100 day moving average, further confirming the bearish momentum in the market for crude oil, while the Stochastic oscillator rebounded from its extreme overbought level on Thursday. If the price continues on its downward trend projectile, we might see some support around the $68,50 price area which consists of the 78.6% of the daily Fibonacci retracement level. In the event that we see yet another correction to the upside, then major resistance could be possibly found around the $74 area, which consists of the psychological resistance of the round number, the 50% of the Fibonacci retracement level and is also just below the 50 & 100 SMAs.
Disclaimer: opinions are personal to the author and do not reflect the opinions of Exness or LeapRate.
Experienced writer and journalist, working in the global online trading sector, Steffy is the Editor of LeapRate. She has previous experience as a copywriter and has been with the company since January 2020. Steffy has a British and American Studies degree from St. Kliment Ochridski University in Sofia.