This article was submitted by Antreas Themistokleous, market analyst at Exness.
This preview of weekly data looks at EURUSD and USOIL where economic data coming up later this week are the main drivers in the markets for the near short term outlook.
The most important economic data for this week are:
Australian inflation rate for Q1 on April 26th at 13:30 PM GMT. The market expectations are for a decline of almost 1% which if confirmed would probably create some minor losses on the Aussie dollar because it could influence a more dovish stance for RBA on their next interest rate hike.
US quarterly advance GDP growth on April 27th at 12:30 PM GMT. The figure is expected to decrease by 0.6% and reach the level of 2% for the first quarter of the year. If the consensus is confirmed then it would be the third consecutive quarter of declining GDP which could possibly affect the dollar negatively in the short term.
EU quarterly Flash GDP growth on April 28th at 09:00 AM GMT. Market consensus is for an increase of 0.2%. Although this data might have already been priced in, volatility is expected to increase around publication time especially for EURUSD.
Preliminary German Inflation rate on Friday at 12:00 PM GMT. The expectations are for a drop of 0.1% for the month of April. If these expectations are met then it would be the lowest figure for the last 7 months. This could impact the Euro negatively ,since Germany is the biggest economy in the EU, since it could potentially influence the ECB to get more dovish on their next meeting.
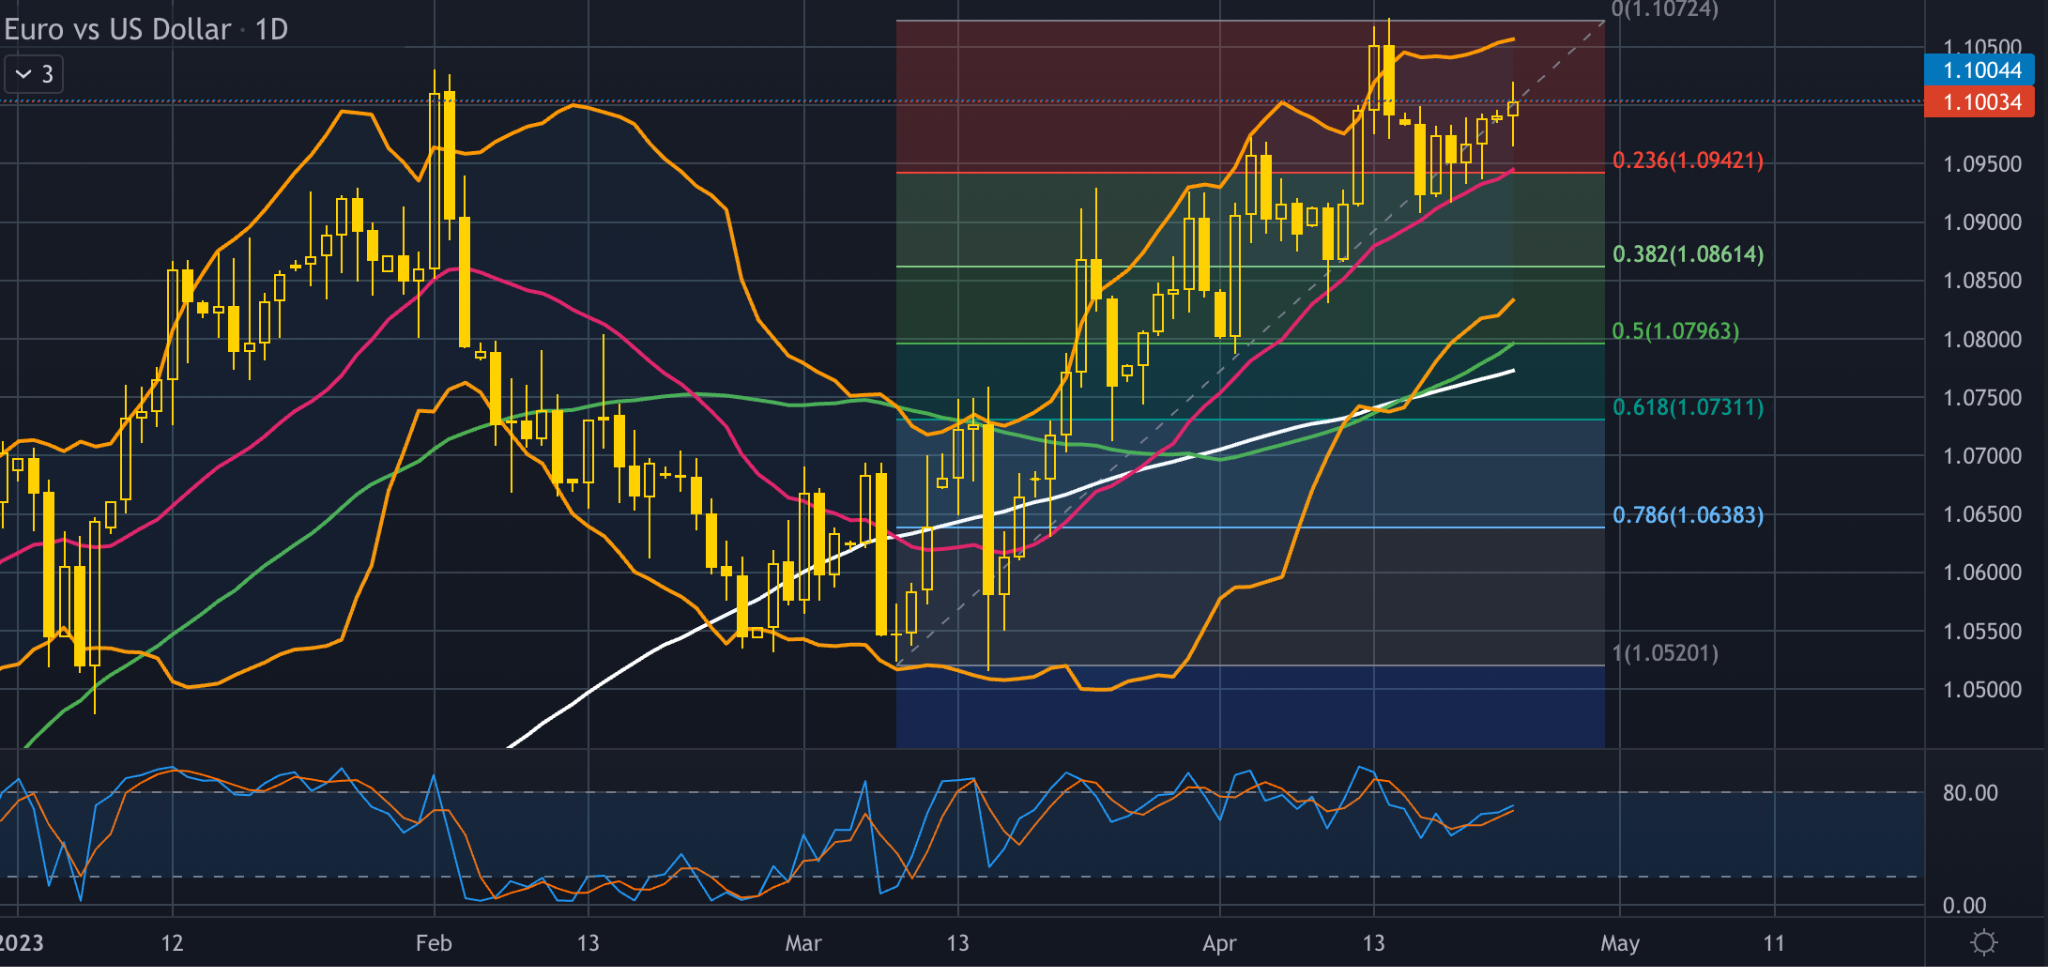
EURUSD, daily
This would likely be a busy week for the fiber pair with economic data coming up later in the week about US & EU GDP as well as inflation rate from Germany expected to create volatility in the Euro and USD pairs. Declining figures in relation to the US housing market of last week has pushed the price on the daily chart to the upside. Although the market impact could be generally limited since the data is backward-looking, and a substantial amount of time has already elapsed between the quarter-end and GDP data publications,many currencies are likely to be very active around these releases, especially the EURUSD pair.
On the technical side the price on the fiber chart has found resistance on the upper band of the Bollinger bands and has since corrected to the downside. The 50 SMA has crossed above the 100 SMA indicating the bull movement is still strong while the Stochastic oscillator is not indicating any overbought or oversold levels. The current level of $1.10 is a psychological resistance of the round number so in the event of a correction to the downside happens in the following sessions we might see some major support around the $1.09400 which is an area on the daily chart where the 20 SMA meets the 23.6% of the daily Fibonacci retracement level making this area a strong technical support.
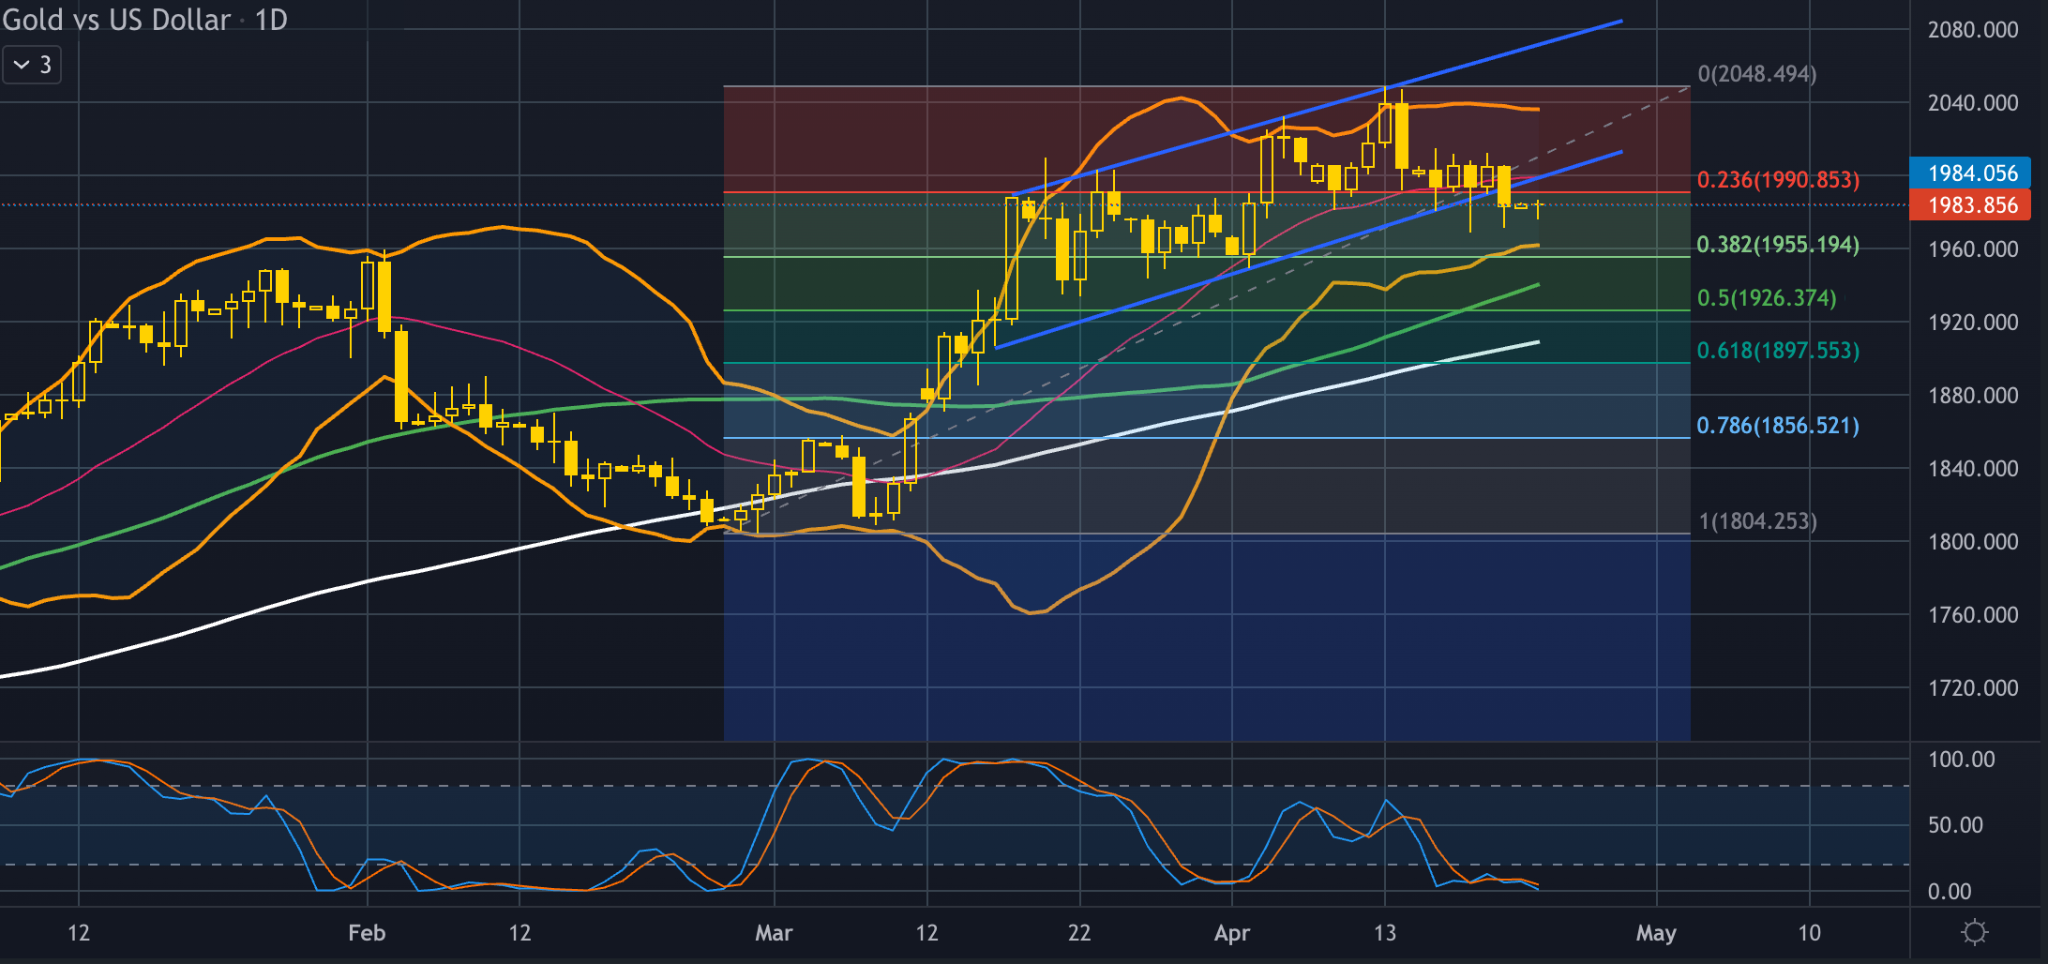
The price of gold is moving in a declining trend for the last 7 sessions since investors and traders are reducing their trading activity on the metal in anticipation of the upcoming FED meeting in early May. Geopolitical risks and recession fears are still high which helps the bulls in pushing the price of the safe-haven asset to the upside. At the time of this report the chances of the U.S. central bank raising rates by 25 basis points is at 90%, according to the CME FedWatch tool.
From the technical standpoint the price is trading in a bearish correction movement and has even broken out of the rising channel formation that was valid since mid March. The Bollinger bands are slowly contracting indicating that volatility in the market for the yellow metal is drying up while the Stochastic oscillator is recording oversold levels for the past week. The overall bullish momentum is still valid according to the moving averages since the slower 50 day has managed to stay above the 100 SMA indicating that the recent bearish correction is not accelerating just yet.
In the event of a continuation of the recent downward movement we might see some support around the $1,955 price area which consists of the lower band of the Bollinger bands and the 38.2% of the daily Fibonacci retracement.
In case of a reversal to the upside we might see some resistance laying around the $2,000 area which is just above the 23.6% of the Fibonacci, the lower boundary of the recent channel formation as well as the psychological resistance of the round number.
Disclaimer: opinions are personal to the author and do not reflect the opinions of Exness or LeapRate.
Experienced writer and journalist, working in the global online trading sector, Steffy is the Editor of LeapRate. She has previous experience as a copywriter and has been with the company since January 2020. Steffy has a British and American Studies degree from St. Kliment Ochridski University in Sofia.