This article was submitted by Antreas Themistokleous, market analyst at Exness.
This preview of weekly data looks at EURUSD and USOIL where economic data coming up later this week are the main drivers in the markets for the near short term outlook.
The most important economic data for this week are:
- Chinese inflation rate on April 11th at 12:30 PM GMT. The current rate of 1% is the lowest level for the last year and it is not expected to change for the figure of April.
- US inflation rate on April 12th at 12:30 PM GMT. The figure is expected to decrease by 0.8% and reach the level of 5.2% for the month of March. If the consensus is confirmed then it would be the 9th month of continuous decline of the figure which could reinforce the probability of a FED pause in the next meeting in May.
- FOMC minutes on April 12th at 18:00 GMT. Investors and traders will be paying close attention to this publication in an effort to get hints on future monetary policy by the FED. The market is expecting the interest rates to peak at 5.25% before the FED pivots and starts cutting rates later in the year while the chairman J.Powell said that this will probably not happen in 2023.
- British monthly GDP on Thursday at 06:00 AM GMT. The expectations are for a drop of 0.1% for the month of February. This data might have already been priced in since it’s for the month of February and in combination with the very small change in the figure we might not see any major moves for the quid.
- US PPI on Thursday at 12:30 PM GMT. The market consensus is for an increase of 0.2% for March. This publication acts as an early indication of inflation when it rises because it shows that costs are rising for the producers which will eventually roll down to consumers resulting in increased inflation.
EURUSD, daily
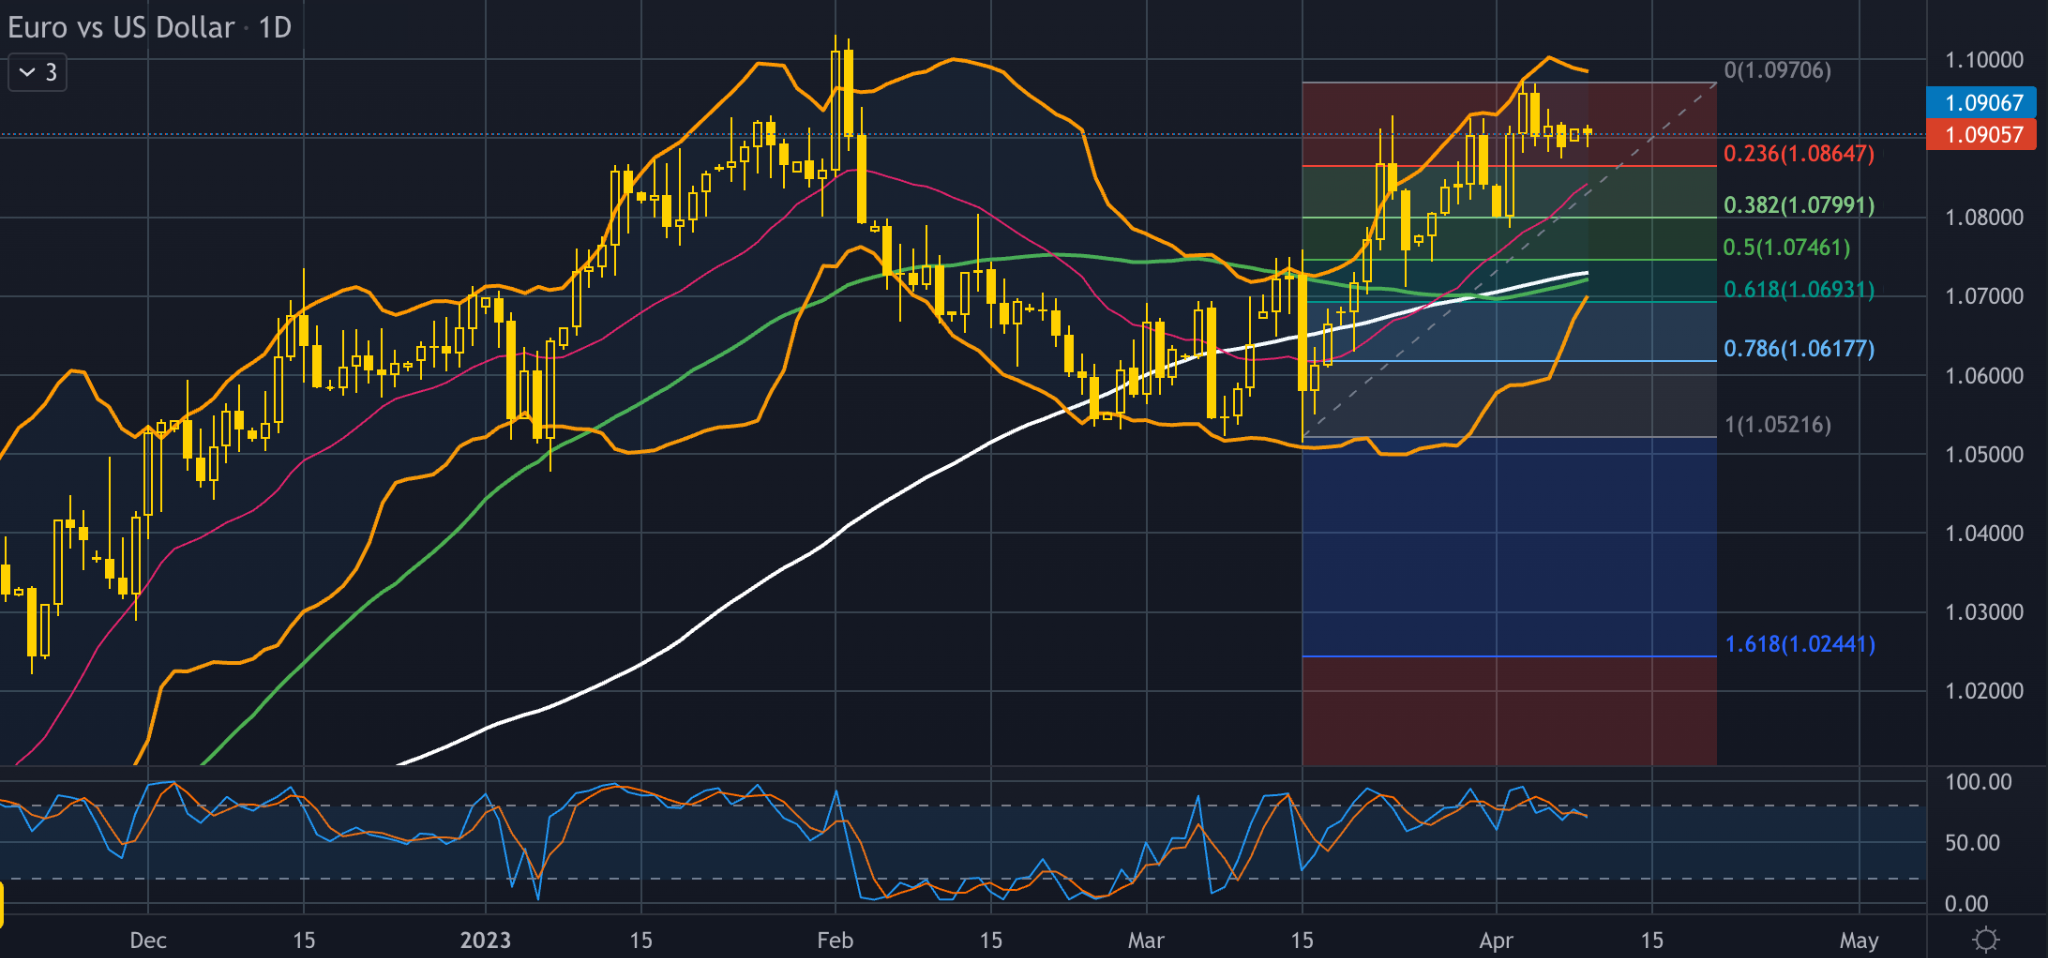
This would likely be a busy week for the Dollar with economic data being released later in the week about inflation, FOMC minutes and Producer Price Index. Jobs data released on Friday suggested the labour market remains strong, pushing the possibility of another interest hike by the FED up. More specifically, markets are pricing in a 65% chance of a 25-basis point rate hike in May, up from 57% a week ago, according to CME’s FedWatch tool. With NFP being old news the focus now shifts on US CPI data due on Wednesday with market expectations for the inflation figure being at 5.2% against a previous reading of 6%.
Inflation has been falling for 9 months consecutively and if the expectations are confirmed in the next publication we might see the percentages of interest hike by the FED changing drastically.