This article was submitted by Michael Stark, market analyst at Exness.
Gold and oil have declined sharply since the end of last week after a strong NFP and increasing nervousness in markets over the spread of the Delta variant of covid-19. Most European and Asian shares have started the week cautiously without large movements. This preview of weekly data looks at GBPUSD and UKOIL.
There was no significant news in monetary policy last week, but expectations of tapering by the Fed have increased since Friday’s good NFP and other employment data from the USA. The Bank of England’s meeting on Thursday brought some positivity for the pound with tightening now likely if the British economy continues to improve. No major central banks are due to meet this week but the BdeM’s statement on Thursday night GMT could be an important driver for the peso.
This week’s key data are American inflation, core and non-core, on Wednesday. Coming in the context of a generally strengthening dollar and some decent evidence of economic growth in the USA, higher than expected figures might give further fuel to relatively hawkish expectations for the Fed’s policy into the end of the year.
British balance of trade on Thursday morning GMT is another important figure. Meanwhile traders of oil are likely to look at the usual stock data and rig count for insights into whether losses might continue this week.
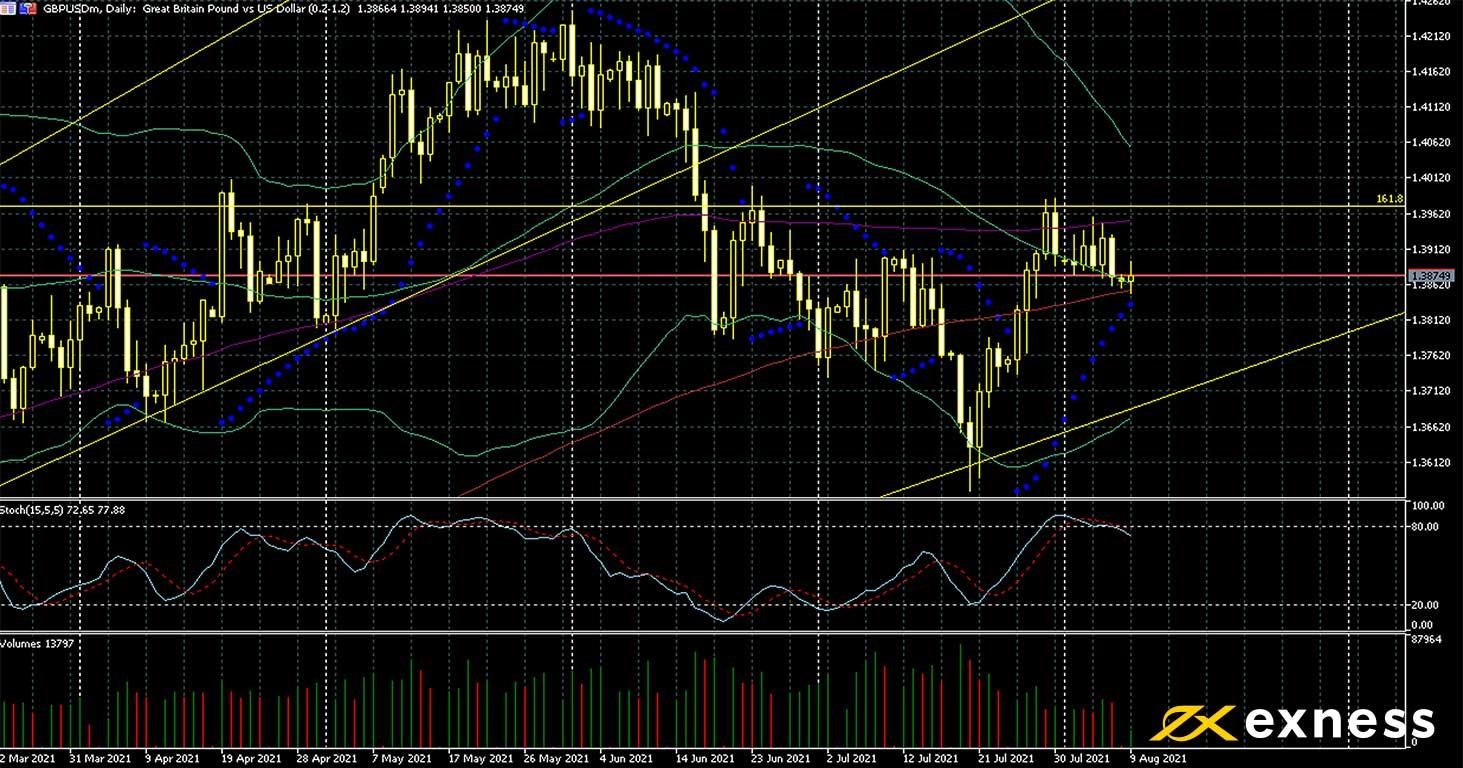
Cable, daily
Unlike euro-dollar which is currently trading around a four-month low, the pound bounced strongly against the greenback late last month and has held consistently above $1.385 in August so far. Part of the reason for this is the widespread perception that the Bank of England is more hawkish (or at least less dovish) than the ECB combined with positivity around the abolition of very many covid-related restrictions in the UK last month.
The pound seems to be standing at a crossroads with key technical references above and below, the 161.8% weekly Fibonacci retracement area and the 200 SMA respectively. Based on TA alone, consolidation and sideways movement would usually be favourable in this situation. However, the important economic releases from the USA and the UK on Wednesday and Thursday are likely to generate stronger movement at least in the short term, possibly making direction clearer if a notable area is broken.
30 GMT: American annual core PPI (July) – consensus 5.6%, previous 5.6%
30 GMT: American annual PPI (July) – consensus 7.3%, previous 7.3%
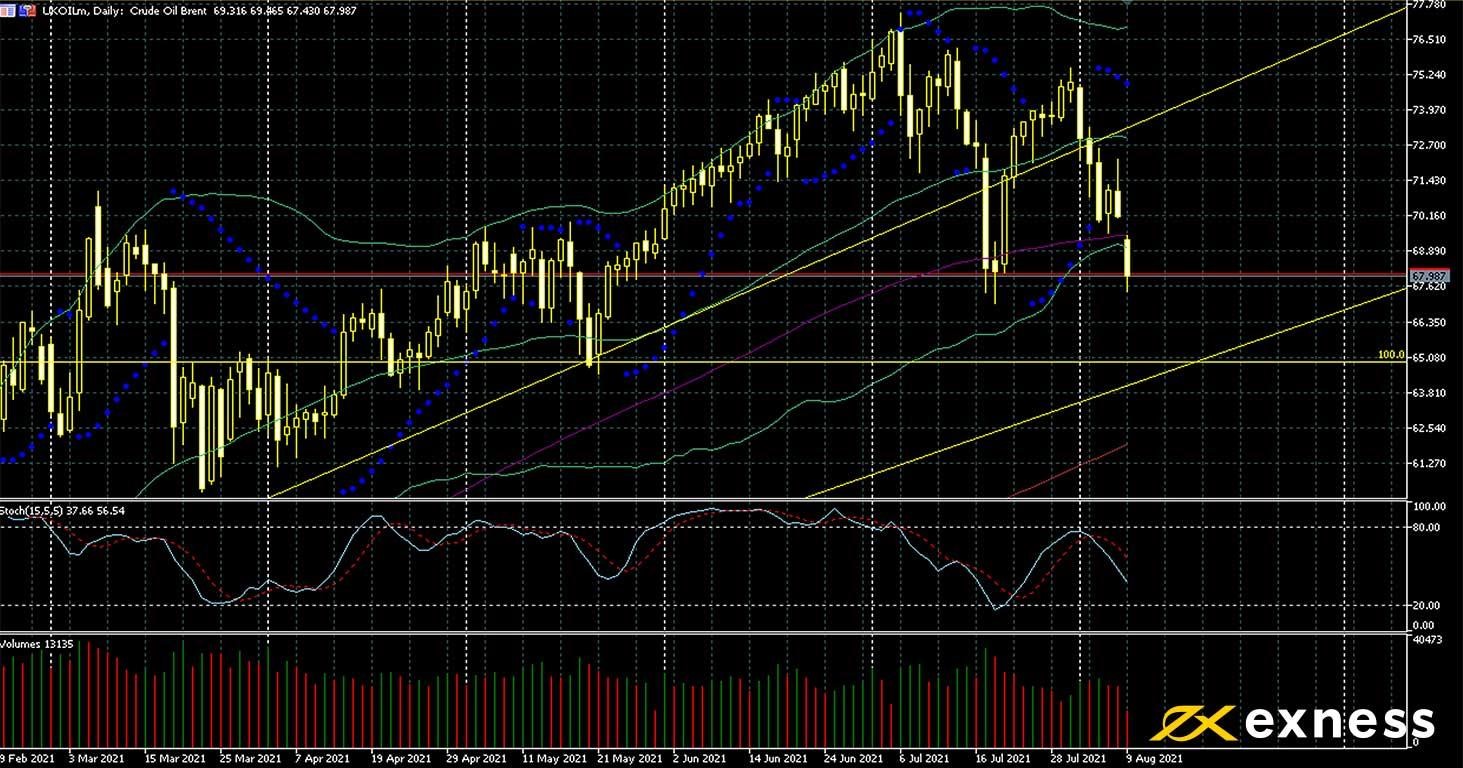
Brent, daily
Doubts about forecasts for demand for crude now that Delta is spreading more actively in key east Asian economies have dented sentiment on crude oil. Also driving losses so far this week has been the good NFP on Friday which gave the dollar a boost. The current round of losses is unlikely to continue into a full downtrend though given the general situation of undersupply in oil markets by most estimations.
From a technical point of view as well, ongoing losses don’t look favourable at the moment. 20 July’s low around $67, the 100% weekly Fibonacci retracement area around $65 and the 200 SMA just below $62 could all be important supports, so significant negative information would probably be required for all three to be broken. A lot hinges this week on American inflation data on Wednesday (see above) and the usual stock figures.
Key data this week
Bold indicates the most important release for this symbol.
Experienced writer and journalist, working in the global online trading sector, Steffy is the Editor of LeapRate. She has previous experience as a copywriter and has been with the company since January 2020. Steffy has a British and American Studies degree from St. Kliment Ochridski University in Sofia.