Technical analysis: Tesla (TSLA) remains technically overbought

This article was submitted by Aaron Hill from FP Markets.


Harmonic Weekly Resistance Holding Firm

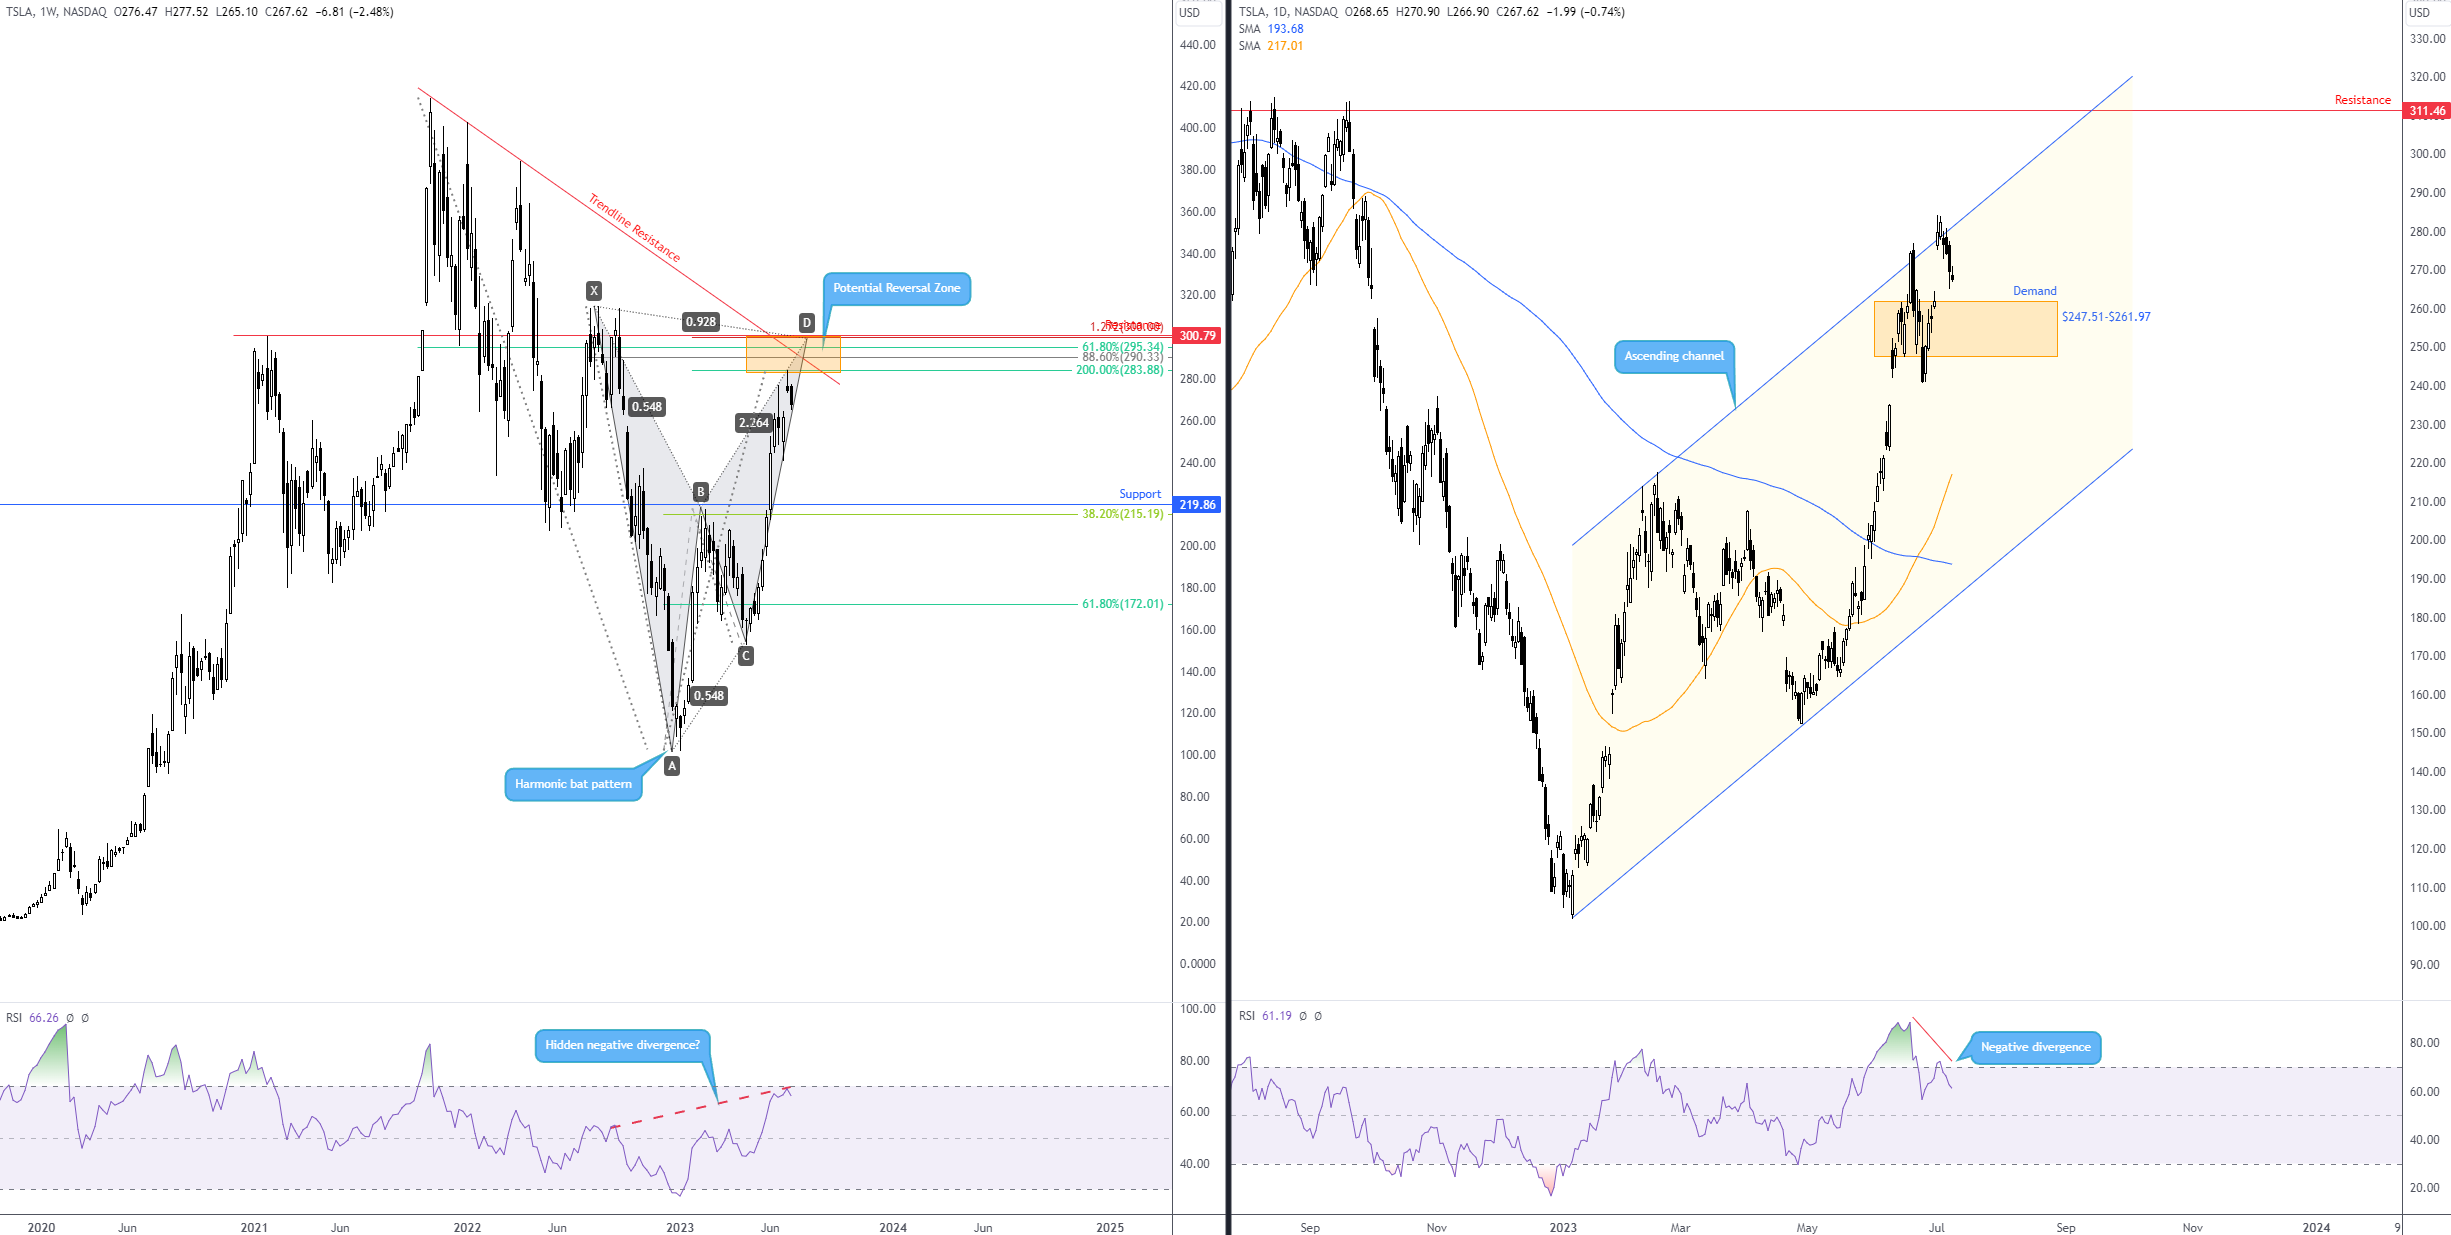
I wanted to return to Tesla (TSLA) today, a stock I featured in this week’s Weekly Market Insight.

As you can see from the weekly chart, sellers have certainly put in an appearance from the harmonic bat pattern’s potential reversal zone (PRZ) between $300.79 and $283.88. WTD, price is down 2.4%.

Now, technically speaking, harmonic shorts from the PRZ may target the 38.2% and 61.8% Fibonacci retracement ratios of legs A-D at $215.19 and $172.01, respectively. It is important to note that sharing chart space with the 38.2% Fibonacci ratio is weekly support priced at $219.86.

Another key observation from the weekly chart is that the Relative Strength Index (RSI) is rotating south ahead of overbought territory. Crucially, though, I also see that there is a chance the indicator could pencil in negative hidden divergence here (this means price essentially leads the way rather than the indicator [as in normal divergences]; in this case, price action forms a lower high, and the indicator forms a higher high).

Market Analysis

Price Action Closing in on Daily Demand

Across the page on the daily chart, you might recall that I noted the possibility of a sell-off emerging from channel resistance extended from the high of $214.00, which was accompanied by negative divergence from the RSI. You may also recall that recent writing pointed to the possibility of dropping in on demand from $247.51-$261.97. As you can see, we have indeed pushed southbound from the aforementioned channel resistance. And according to the weekly chart showing room to explore deeper waters and the RSI indicators demonstrating negative divergence on both timeframes, testing the mettle of the daily demand zone remains on the table.

Suppose the stock engulfs demand at $247.51-$261.97. In that case, this perhaps paves the way towards the 50-day simple moving average at $217.03, which happens to converge nearby weekly support mentioned above at $219.86 and, of course, the 38.2% Fibonacci retracement ratio derived from the harmonic bat pattern at $215.19.

Tesla (TSLA) Remains Technically Overbought, FP MarketsCharts: TradingView

In case you missed it, Market Insight: Week ending 14 July … Read More


Disclaimer: The information contained in this material is intended for general advice only. It does not take into account your investment objectives, financial situation or particular needs. FP Markets has made every effort to ensure the accuracy of the information as at the date of publication. FP Markets does not give any warranty or representation as to the material. Examples included in this material are for illustrative purposes only. To the extent permitted by law, FP Markets and its employees shall not be liable for any loss or damage arising in any way (including by way of negligence) from or in connection with any information provided in or omitted from this material. Features of the FP Markets products including applicable fees and charges are outlined in the Product Disclosure Statements available from FP Markets website, www.fpmarkets.com and should be considered before deciding to deal in those products. Derivatives can be risky; losses can exceed your initial payment. FP Markets recommends that you seek independent advice. First Prudential Markets Pty Ltd trading as FP Markets ABN 16 112 600 281, Australian Financial Services License Number 286354.

Opinions are personal to the authors and do not reflect the opinions of LeapRate. This is not a trading advice.

Read Also: