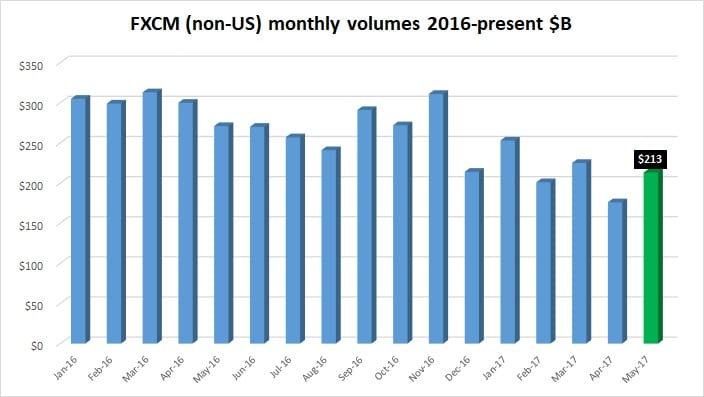
Retail forex broker FXCM Group LLC has announced that its trading volumes rose by 21% during May, to $213 billion. The monthly results were helped by having 23 trading days during May, versus just 20 in April, but on a daily average basis volumes were still up 6% in May.
The rise in volumes at FXCM, after a fairly weak April, were fairly in line with the volume increase we have seen in May from several other leading retail FX brokers. And, they certainly testify to the continued strength and resiliency of the FXCM brand, despite the company’s recent problems, as outlined below.
The results of course represent trading volumes outside the US. FXCM sold its US clients to the Forex.com unit of rival Gain Capital Holdings Inc (NYSE:GCAP) in February, after the company and now ex-CEO Drew Niv were banned from the US forex market.
FXCM Group LLC (the operating company which reports the figures) is owned 50.1% by Global Brokerage Inc (NASDAQ:GLBR), formerly known as FXCM Inc, and 49.9% by Leucadia National Corp (NYSE:LUK).
FXCM’s full report on May customer trading metrics reads as follows:
FXCM Group Reports Monthly Metrics
NEW YORK, June 13, 2017 — FXCM Group, LLC (“FXCM Group” or “FXCM”), a leading international provider of online foreign exchange trading, CFD trading, spread betting and related services, today announced certain key customer trading metrics for May 2017 for its retail and institutional foreign exchange business.
May 2017 Customer Trading Metrics from Continuing Operations:
- Customer trading volume of $213 billion in May 2017, 21% higher than April 2017 and 21% lower than May 2016.
- Average customer trading volume per day of $9.3 billion in May 2017, 6% higher than April 2017 and 24% lower than May 2016.
- An average of 334,536 client trades per day in May 2017, 4% lower than April 2017 and 32% lower than May 2016.
- Active accounts of 128,242 as of May 31, 2017, a decrease of 1,124, or less than 1%, from April 30, 2017, and a decrease of 5,141, or 4%, from May 31, 2016.
- Tradeable accounts of 109,295 as of May 31, 2017, an increase of 412, or 0.4%, from April 30, 2017, and a decrease of 5,882, or 5%, from May 31, 2016.