The following article was written by AMarkets, a St. Vicent & the Grenadines (FSA) regulated global forex broker established in 2007.
Cryptocurrencies are well established in the portfolios of private investors, who, unlike institutional funds, do not fear huge volatility and vulnerability to speculation. The same thing that attracts new investors is, at the same time the scariest factor – the very volatility. It will be hard to find a currency pair that will show a daily range of +/- 10%.
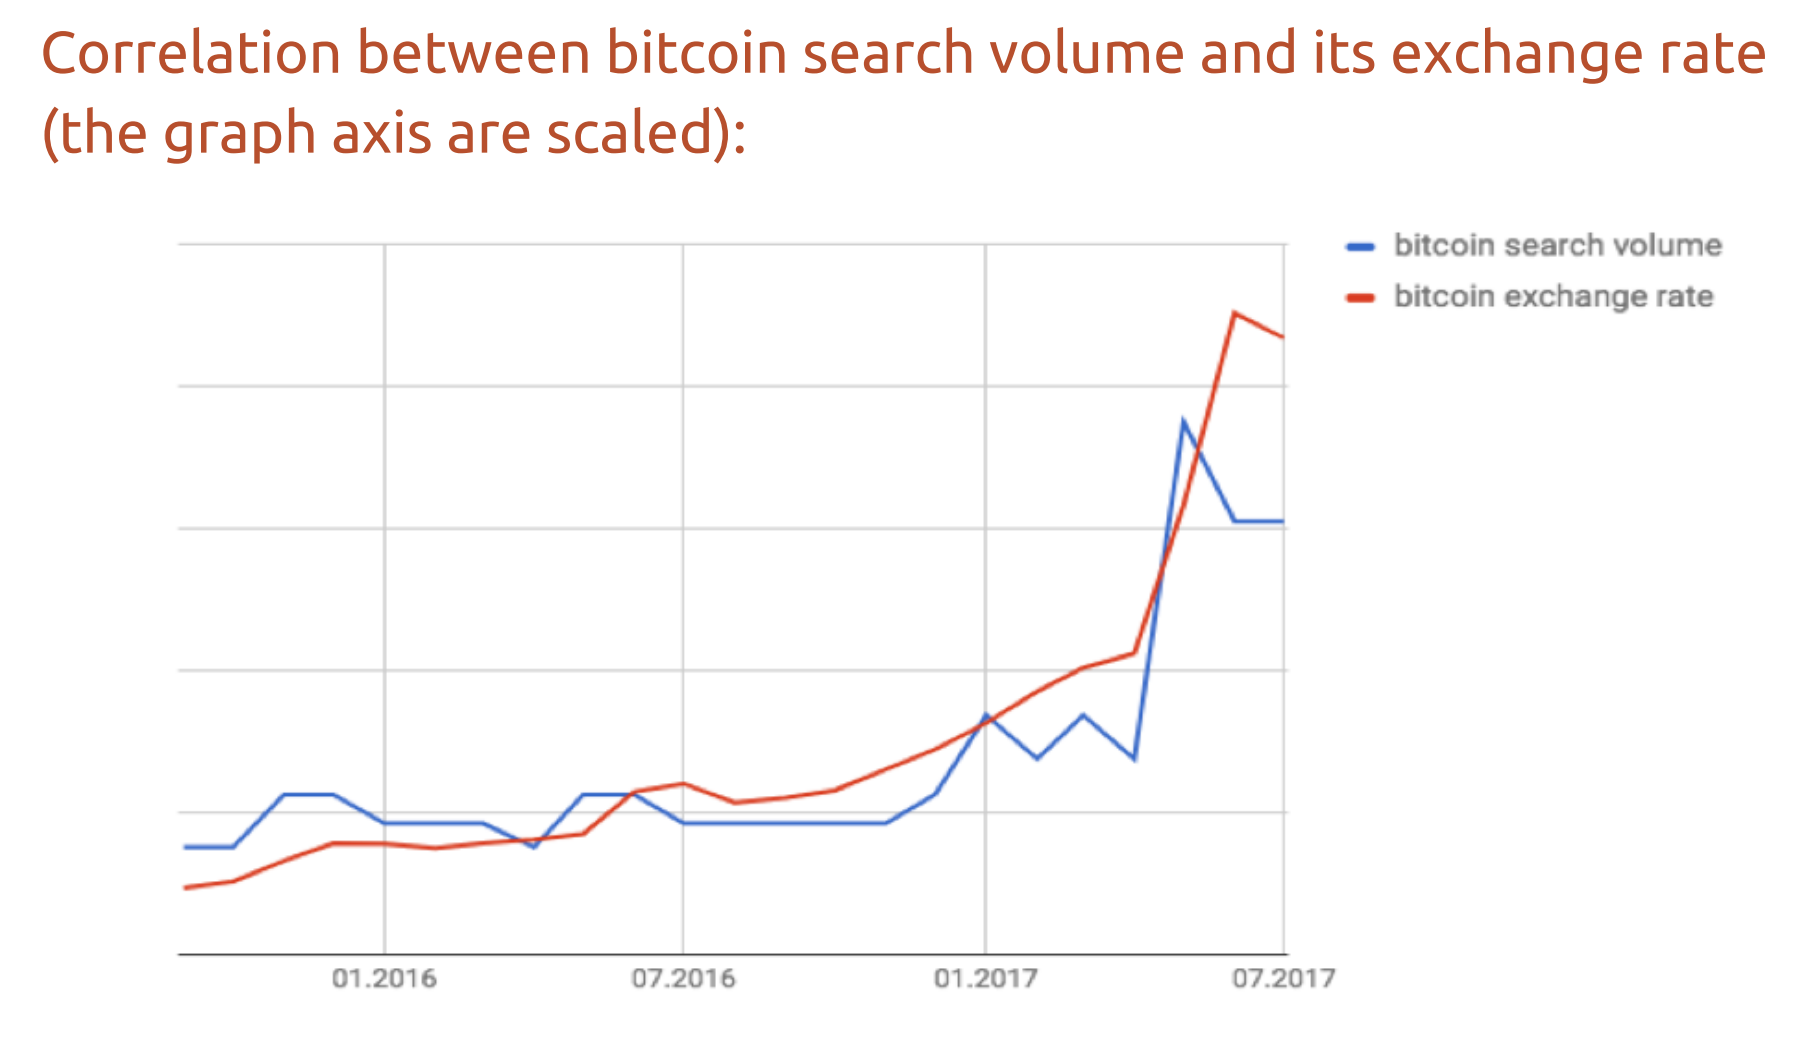
The “Digital Klondike” did not thrive for so long, and the global uptrend of the crypto market changed its direction at the end of December, which caused a great panic among market participants and crypto asset owners, especially among those who joined it in the last few months, picking up the fashion trend that even got to TV. Publicity and popularity on the Internet and TV play a very important if not a key role, when it comes to new markets and assets. SEMRush also found out that the current Bitcoin price has a correlation of 91% with the volume of Google searches related to this cryptocurrency.
And here we come to a key point: all those who joined the crypto market after the middle of 2017 have no idea about the cyclicity and patterns of this market. And it, in turn, explains much of what’s going on in the crypto world since the beginning of 2018. Traders who have been in the market since the beginning of 2017, noticed the similarity, with great accuracy, of the Bitcoin rate movement, the leader of all crypto assets, at the beginning of 2017 and 2018. So, what do we say about the enthusiasts, who have been in the market for more than three year? for them, the sharp drop of bitcoin from $ 20,000 to $ 10,000 and the subsequent decline was more than predictable.
A true but funny saying, popular in the community comes to mind:
The new Lamborghini of the crypto traders were bought with the funds of those who came into the market at above $ 17,000.
Based on these simple facts, we can distinguish several successive events:
- As bitcoin approached the $ 10 000 mark, a “hype” wave was building up a lot of “stupid money” from amateurs.
- At the same time, the crypto market old-timers began to feel overheated, and as the Bitcoin’s rate of impulsive growth was higher than the psychological mark of $ 10 000, “smart money” came out of the market and recorded profits of more than 100%.
- The most experienced traders who have been in the market for more than three years are already beginning to carefully analyse the market and look for entry points in short positions.
Separately, it is worth noting an event such as the Chinese New Year; this event, throughout the life of Bitcoin has had a significant impact on the rate, causing a marked decline and a general stagnation of the crypto market from the beginning of February to the end of March every year.
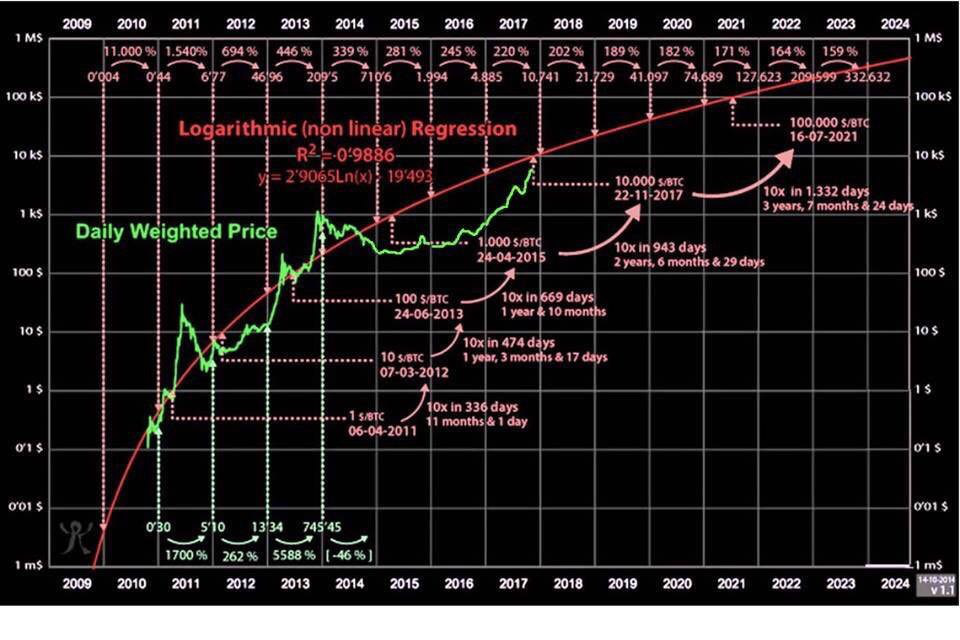
The graph below shows the logarithmic regression of the growth rate of Bitcoin prices and the weighted average market price. The graph is to scale.
It is on it, that the events that precede and follow after the overheated market are perfectly distinguishable. With the exception of 2014, in general, the picture is very similar: once the price chart breaks significantly above the level of the logarithmic price, a downturn period of about 5-6 months is inevitable, which is simply necessary, in order to eliminate the overheating of the market, restore the balance between supply and demand in the market and make Bitcoin attractive again to new investors, the very same “stupid money”.
What can we summarize from this review? Probably the most important thing is that the scale of the last drop of the crypto market as a whole is greatly exaggerated; Bitcoin also saw a larger fall, this time more numbers, but not amplitude. And again it’s worth noting that for experienced market participants these events were predictable and opened up excellent opportunities to record profits, and also earn even more by opening short positions starting from mid-December.
Conclusions
After revealing so many patterns, any person interested in the industry has a natural question: at what stage is the crypto market now and what is waiting for us in the near future?
By simply applying the pattern of the current price chart of the Bitcoin rate on historical data, one can understand that now we are in the last phase of regression, in which we can already consider the prerequisites for recovery and further growth, among them, the growth of trading volumes at the rate’s fall and fixing the price chart near the key support levels formed by moving averages.
And what awaits us in the foreseeable future and until the end of 2018? Returning to the annual cycles of Bitcoin prices, it is possible to assert with a high probability, that a significant price increase should be expected not earlier than August or September, when the financial markets become fully operational after the “idle” summertime and Bitcoin again becomes appealing to new investors.
In general, to call the events of the last three months the crash of the crypto market is fundamentally wrong, this definition can only be suitable for those who entered the overheated market at insanely high prices.
Lastly, I would like to recommend a fairly simple and effective strategy for trading at the current stage of the development of the crypto market and to give some obvious but very important advice on the psychology of trading on cryptocurrency.
Strategy for Moving Average
This strategy is easy to disgrace, but at the same time showed an excellent result in the bear market between December 20 and the end of February; both short and long positions are possible within this strategy, but I emphasize that the viability of this method is proved only in downtrend conditions.
Thus, the strategy itself:
MA20 (Moving Average) – a moving average with a period of 20. The graph confidently punches it down – sell, up – buy. Under a sure breakthrough we mean a range from $ 75 to $ 175, that’s it, no more tweaks are required; when checking these parameters by historical data, the strategy shows a profitability of 80-95% for 2.5 months (the range is specified, because each trader himself determines whether a particular intersection is a true or false breakdown).
A few simple rules
- Do not give in to pressure: do not start trading unless you see good entry conditions and exit strategies. Trades under pressure are most often failed. Wait for the right moment. It’s better to be out of the market than in the market with losses.
- Buy on the rumors, sell on the news. When news of growth reaches the largest non-core news sites, let alone TV, is the time to exit the position. Personally, this advice helped me to save the lion’s share of my capital: when, at the beginning of December the “white noise” about the crypto industry started across all channels, I prudently merged most of the crypto assets into fiat.
- You had a good trade, you closed it with an excellent plus, but like always, after the sale, the price continued to rise. First, get acquainted: this is Murphy’s Law. Secondly, re-read the above mentioned and never return to a position under pressure. While you have a profit – you are in the black. Better start working on the next trade and do not lose money on level ground.
- Reduce your ego. It’s not whether you are right or not. It is about the profit. Do not waste resources (time and money) to prove to yourself that you should not have entered this position. Remember: there was not a single trader who did not lose money. At least sometimes it happens to everyone. The main thing is to get more than lose.