
Bitcoin enthusiasts were hopeful last week that a familiar technical pattern would come to the rescue of their beloved digital asset, but it was not to be, at least not yet. The pattern that got everyone excited was what is called a “Double-Bottom Reversal”. If you calculate the distance from the bottom to its “neckline”, then odds last week were in favor of a run up to the $9,400 range or thereabouts. Arguments have abounded that a consolidation phase was in process, which tends to end well with a bolt to the north.
As with any prediction predicated on technical analysis, there are probabilities galore as to what to expect. For the scenario described above, the odds generally exceed 60%, the reason why traders develop trading strategies around them, but probabilities are just a guess with an edge, if you will. There are also varying degrees of Double-Bottoms, as well, but the Bitcoin version over the past few weeks is classical textbook, the primary reason that excitement was mounting. For now, however, momentum subsided.
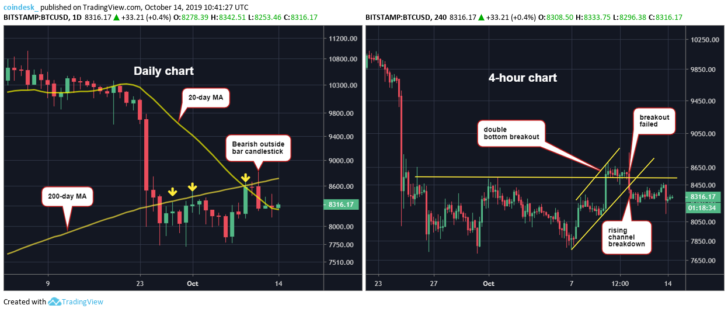
In this chart provided by Coindesk, the Double-Bottom is clearly visible in both the Daily, as well as the 4-Hour timeframes. In the equity world, this type of formation can take as many as three months to fall into place, but in the crypto-verse, things happen more quickly. Bitcoin accomplished this “feat” in three weeks. When BTC bolted forward last week, as evidenced by the larger “green” candlesticks, it crossed the “neckline”, depicted by the gold horizontal line on the 4-Hour chart.
From that point on, analysts were strongly suggesting that Bitcoin could jump again to $9,400 this week, but, as can be seen on the 4-Hour depiction on the right, the breakout failed. Bitcoin fell beneath the “neckline” at $8,500 and has been muddling through ever since that breakdown. The question now is can Bitcoin regroup and try again? Yes, anything is possible. It has been stuck in an 8% range for three weeks. Bollinger Bands are tightening, a good sign that volatility could explode in the near term, but we wait.
For now, the bears have not gone into hiding. Their presence is still felt on the battlefield. Despite the recent price activity, neither bears nor bulls have shown the energy or volume necessary to establish a definite new direction for the near term. From a technical perspective, however, the 200-Day moving average still looms large on the horizon, as, pardon the over-worked expression, formidable resistance. It now sits at roughly $8,700, and if BTC is to break above $9,000, it must clear this hurdle convincingly and stay above it.
Josh Rager, a popular crypto analyst on Twitter, predicted the recent bout of volatility, but he, too, has a difficult time now being bullish, unless he sees a forceful move. As reported by NewsBTC, here are two of his recent tweets:
- “With three weeks of sideways and the bbands starting to pinch, Bitcoin price could see some volatility soon.”
- “$BTC update: Currently ranging in between but with the inability to close back above $8,375 area after that fake-out to $8,800 and lack of volume… Leaves me feeling more bear biased. Sorry, there’s no reason for me to feel bullish anytime soon until this range breaks up.”
Ranging behavior can be monotonous and frustrating, but, at the moment, we have no choice but to wait out the current “malaise” and expect volatility to pick up soon.