Bitcoin enthusiasts have been jostled about after the disappointing Bakkt debut, losing 20% or more of their gains for the year and fearing the worst going forward. For those reasons alone, it is easy to see why Bitcoin’s supporters are searching madly for any technical signal that might be glowing “Green” at the moment. It is not as easy as it used to be before the second quarter came to a close. The third quarter was a loser, to put it mildly, but hope springs eternal when the future prospects of Bitcoin are discussed.
If you had to count heads, there seem to be more analysts that expect another downward turn in the not too distant future. There still remains an unfilled gap on the CME futures exchange in the low $7,000s, and there was a “Bear Cross” recently when the 50-day and 100-day moving averages crossed. More significantly, however, is the fact that the 200-day MA is no longer providing support, as it had for months.
This last dip pushed BTC squarely below it, and if there was truth to the phrase, formidable resistance, then you could attribute that trait now to this moving average. Bitcoin needs to push through and close above roughly $8,600 to remove this barrier. It has been hovering about $8,000 for weeks, dropping into the high $7,000s on occasion, but always jumping right back. At this writing, Bitcoin is surging. It has crossed $8,600, but it remains to be seen if this move is a momentary blip or a fundamental gyration.
In the meantime, the optimists in the crowd are glowing over the following chart:
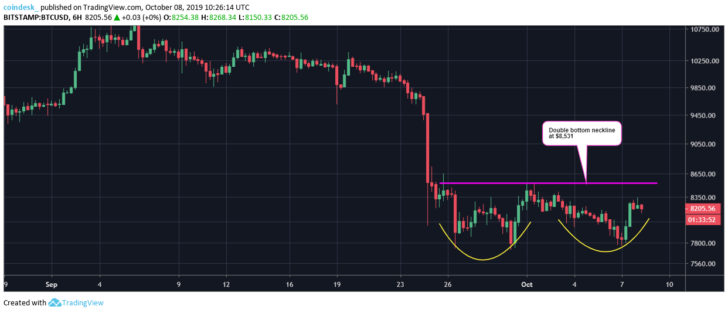
This 6-Hour BTC chart, courtesy of Coindesk, is a rare timeframe to select, but it happens to depict more clearly what can also be surmised from other timing choices, and that is the prominent “Double Bottom” reversal pattern. The second bottom is a bit higher, suggesting support for a surge, which is actually taking place now in real time. BTC has already blown past the “Neckline”, annotated with the purple line, and if the odds for this type of formation hold, then we might see Bitcoin rise to $9,500 or so.
“Big Cheds”, another popular crypto analyst on Twitter that appears on CNBC from time to time, saw this reversal coming, as well, but for different reasons. He noticed what he calls a “Tweezer” pattern on the last rendition of a weekly chart. The Tweezer is formed when you have two candlesticks with long wicks of identical length. When this shape happens and the wicks are lower, not upper, then a price reversal to the north side is of the higher probability. Big Cheds also combined this thinking with the fact that Bitcoin was bouncing off lower Bollinger Bands at the time, more evidence for his thesis.
Cointelegraph also reports that this CNBC analyst sees a few positive signs in the Altcoin market, but nothing he would tout as a return of Alt-season:
Alts, in general, have been improving, with several of them forming bottoming patterns, while others have been uptrending, including LINK, XRP, and TNT. That being said, many of them still are weak and look to continue further down, and I reject any categorization of alt season.
As for the overall crypto market, Big Cheds is one of the long-term optimists. He concludes with:
The crypto market, in general, continues to grow as technology improves and we see exchanges adapting to fluctuating retail and institutional market. I am very bullish long term.