
April is now in the history books, and Bitcoin, to the amazement of its stunned critics, has outperformed once more, delivering positive gains for a third month in a row. These gains are even more remarkable when you factor in that a major scandal broke at the end of the month, regarding reserve funds at Tether’s USDT stablecoin system. All cryptos took a dive, but BTC bounced off $5,000 and is now pressing against $5,400. As the smoke clears, analysts are back to their charts, searching for clues about what might happen next.
Before the alleged $850 million fraud hit the airways, the entire analyst community was exuberant, to the point of being irrational, if you heeded comments from the cynics in the crowd. When April commenced, Bitcoin exploded out of the starting blocks, gaining $1,000 in a single hour and blowing past $5,000 in its wake. $5,500 came soon enough, but then the sky went dark, as news about the Bitfinex and Tether debacle spread like wildfire. Predictions had been coming fast and furiously, positing $10,000 by yearend and then several multiples thereafter. Crypto enthusiasts were rejoicing the world over.
Now, in the aftermath, analysts have pulled back a bit. Cautious optimism has overtaken Crypto-Land, except for possibly Tom Lee, a respected Wall Street strategist and the Head of Research at Fundstrat Global Advisors. He quickly shrugged off scandal overtones and reiterated his position:
I think you’re seeing signs that fundamentals are improving, technicals are improving, and now there’s real activity by, essentially, crypto hodlers… All this goes to show that bitcoin’s not done climbing, and that these catalysts are “likely” to drive it to new all-time highs “around” 2020.
Analysts are split 50/50 over where Bitcoin could go next.
The scandal hoopla has awakened a few bears from their hibernation caves. These bears seem to be fewer in number these days, as several of their former minions have shifted allegiances and joined the bulls. The cynical rant, however, has not changed that much. Back in January, the call was for a fall beneath $2,000 and then some, but now the nether regions are to be somewhere between $3,000 and $4,200, based on whatever arcane chart or method of analysis supports such a proposition.
Murad Mahmudov, a Princeton graduate turned diehard crypto trader and now chief investment officer of Adaptive Capital, has a social media fan club that hangs on his every prediction. His previous calls have earned him a reputation: “The trader recently confirmed that a long-term downtrend line for the aggregate value of all cryptocurrencies was hit for the eighth time in a row.” In late January, however, Mahmudov, based on 300 and 400-Day moving averages, forecast a low point of $1,700 for Bitcoin. He has now changed his tune. Using a number of common indicators, he sees a definite move up to $5,700 (which may have already begun) and, possibly, $6,400 shortly thereafter.
Beside Bitcoin cynics and those that have converted to more optimistic outlooks, there are several analysts that are slowly recovering from the latest scandal-driven setback and issuing revised prognostications about Bitcoin’s near and long-term future. What has changed? In order to support a new theme post-scandal, this cautious group is searching for what may be termed a “Holy Grail” of charts, the one and only nugget of truth that contains the secret insights that no one else has discovered.
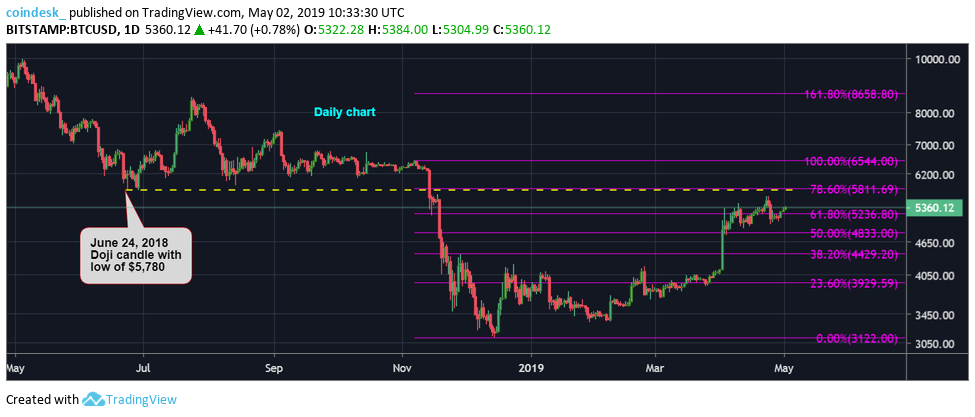
The above daily chart for Bitcoin, courtesy of TradingView, is all that you really need to hit the finer points. The current bull-run began in later December, after the market bottomed out at roughly $5,130. A vast majority of analysts have reached this consensus, part of the reason why cynics are not suggesting anything beneath this level at present. Fibonacci lines have also been added to highlight various expectations for resistance and support.
The obvious “Pole and Pennant” formation at the right side of the chart sent a shot of adrenalin through the veins of the crypto community a few weeks back. It is a very bullish signal that more good times are coming. You could also draw two diagonal lines, thereby forming a converging “Wedge” pattern, an equally positive sign of building momentum. Lastly, a “Golden Cross”, the intersection of a 50 and 200-Day moving average, occurred (not shown on this chart) and became the icing on the cake.
What are crypto optimists forecasting for Bitcoin in both the near, as well as, the long-term? We have already mentioned Tom Lee, as the first out of the gate to recommence positive guesstimates post-scandal. Here are a few more:
- Twitter regulars with monikers to match, such as Pierre Crypto and Satoshi Flipper, agree that April activity has solidified support at the $4,000 and $5,000 level and that a bull market, rather than a bear, is the new normal.
- Several articles have concluded that $6,000 is the next stop, but that the yellow-dashed line in the above chart, a key Fibonacci level, will offer strong resistance at roughly $5,800.
- Bitcoin Bravado analyst Jack is focused on the daily chart and the “ascending broadening wedge” pattern, indicative of a bull market. He foresees a $6,250 value, a pullback to $4,800, and then there will be a “continuation of the bull trend” to dramatically higher values over the following months.
- DonAlt, a popular cryptocurrency analyst on Twitter, concurs that strong support will enable a major thrust forward: “$BTC monthly: This is the first time in ages that BTC has broken resistance & closed above it. We’ve finally got support below us that might actually hold, turning my big timeframe bias bullish. I’ll stick with swing longs until that support fails. Buys in green (i.e., “green” candlesticks) would be juicy.”
- Galaxy, another popular cryptocurrency analyst on Twitter, is mesmerized by the similarities between now and October 2015: “Observing structure similarities between the monthly candles of October 2015 and April 2019. October 2015 marked the start of most significant bull run in BTC history after a 6500% price surge in 2 years. Another similar bull run puts BTC at over $330K/coin, by the end of 2021.”
What? $330K/coin by 2021? In order for that to even have a chance of happening, there would need to an enormous influx of capital into the crypto-verse. Per one analyst:
An influx of capital from corporations and institutions, which would in-turn lead to an inflow in consumer investments, may be enough to fuel another parabolic upwards move that many embattled investors are anticipating.
Have you noticed lately that the word ‘parabolic” has re-entered the crypto lexicon, once again? While several chartists may firmly believe in the messages they divine from their various representations of price behavior, technical analysis is not a perfect science, especially in our nascent crypto industry where robust databases have yet to form. Herd mentality has a way of being incorrect. As Mark Twain once scoffed: “You pays your money, and you takes your choice.” Caution advised!