
Financial markets are in turmoil. The forever feared interest rate inversion has occurred. When 10-year Treasury yields drop below those for 2-year Treasuries, it is an alarm that a recession is on the way, perhaps, within the next 12 months. This indicator is our most trusted and accurate one for predicting recessions, having been on the mark for the last seven economic downturns. Equity markets collapsed on the news, and, unfortunately for crypto investors, Bitcoin values tanked in unison, contrary to recent storylines that BTC had earned a new status among investors of being a “safe haven”.
Although quite young in its development at this stage, Bitcoin analysts have found what can also be termed as an accurate leading indicator for the future prospects of the world’s favorite digital asset. The indicator is called, most appropriately, the “Fear and Greed Index”. This index may be steeped a bit in mystery, in that the actual algorithms used to measure investor sentiment are not fully understood. Suffice it to say that its creators combine market volatility with social media data, then throw in a bit of survey data to arrive at a value. The index, shown below, just hit its lowest point since 2018:
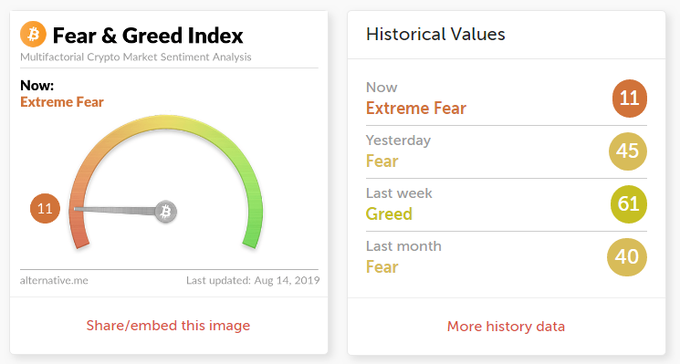
Source: ccn.com
As depicted, the index took a drastic plunge over the past 24 hours, as financial markets prepared and reacted to distressing economic news. Movements such as this have preceded most major downturns in Bitcoin valuations. It also works in the opposite direction, as well, although it may take a bit more time before BTC prices rise to the occasion and play catch up with index values. For those of you interested in more information, click here.
As confirmation of the indicator’s voracity, Bitcoin has fallen sharply in the last two days from a perch at $11,400, all the way down to $9,600, before bouncing like a “dead cat”, as they say, back to $10,000. For the past month or more, the analyst community has been telegraphing that it was time for one more major correction before Bitcoin could ever hope to reach $20,000 and that this might be the last great buying opportunity, as well. One group of buyers has jumped to the mark at $10,000, but it remains to be seen if this support level holds.
According to the gauge’s developers, they conduct weekly polls, canvassing as many as 3,000 people that show interest in the crypto market. This sample figure ensures that they have what is called a “valid statistical sample”, one where the degree of error is small. They then convert this survey data to a figure, which they then combine with five other data elements to arrive at a numerical value between 0 and 100. The “0” value signifies abject Fear, while the “100” value indicates absolute Greed. The proportions of each data element taken are as follows:
- Surveys (15%)
- Volatility (25 %)
- Market Momentum/Volume (25%)
- Social Media (15%)
- Dominance (10%)
- Trends (10%)
What do veteran traders and analysts think of this index? Alex Krüger, a global macroeconomist, trader, and followed analyst on Twitter, commented for the ccn.com:
I don’t like the index’s construction much, but it has been relatively accurate at pinpointing bottoms or near abouts on the daily. I don’t trade off of it but it sometimes lines up with the chart nicely and with traders on social media and private chats going dead silent.
Alex also noted that he is not afraid of such low index values, but he believes that buyers will eventually jump in and provide support around $10,300.
How accurate a leading indicator is this index? As always, the past is never a true predictor of what the future might hold, but the index over time does “mirror” the ebbs and flows of Bitcoin rather well. There are timing gaps. It is not perfect, but it can be one more tool to assist you in your assessment of investor sentiment. From there on, it is anyone’s guess.
More recent BTC news can be found below: