
Crypto analysts are a happy lot these days. It is decidedly more fun arguing over how high Bitcoin can go, rather than defending the crypto leader amongst a rabid group of critics. Bitcoin’s meteoric rise has been a thing of beauty, yielding ample opportunities for the use of technical analysis (TA) to justify its current position, while providing the means to forecast a creditable target down the road. The debate for the past six months, however, has been if and when a firm bottom would form and Crypto Winter would end. We are now in transition, as the debate shifts to confirm if a Bull run has commenced.
While there has been a general consensus in the analyst community that the long-anticipated bottom formed in late December, there is anything but congruence on the evidence that would solidify consensus that Bitcoin is either already in or about to begin a true Bull run that will recover its past glory, i.e., return it to its $20,000 pedestal high in the sky. During this exercise, cynics have remained quiet, keeping their powder try and waiting for the consummate moment to commence their attack.
Bitcoin’s recent movements have been as quick as lightning. If you closed your eyes or walked away from your computer screen or phone app, you could very easily have missed a severe jerk, either up or down. The suddenness of market moves has led many analysts to follow hourly charts, in order to glean the latest insights. Here is just one example:
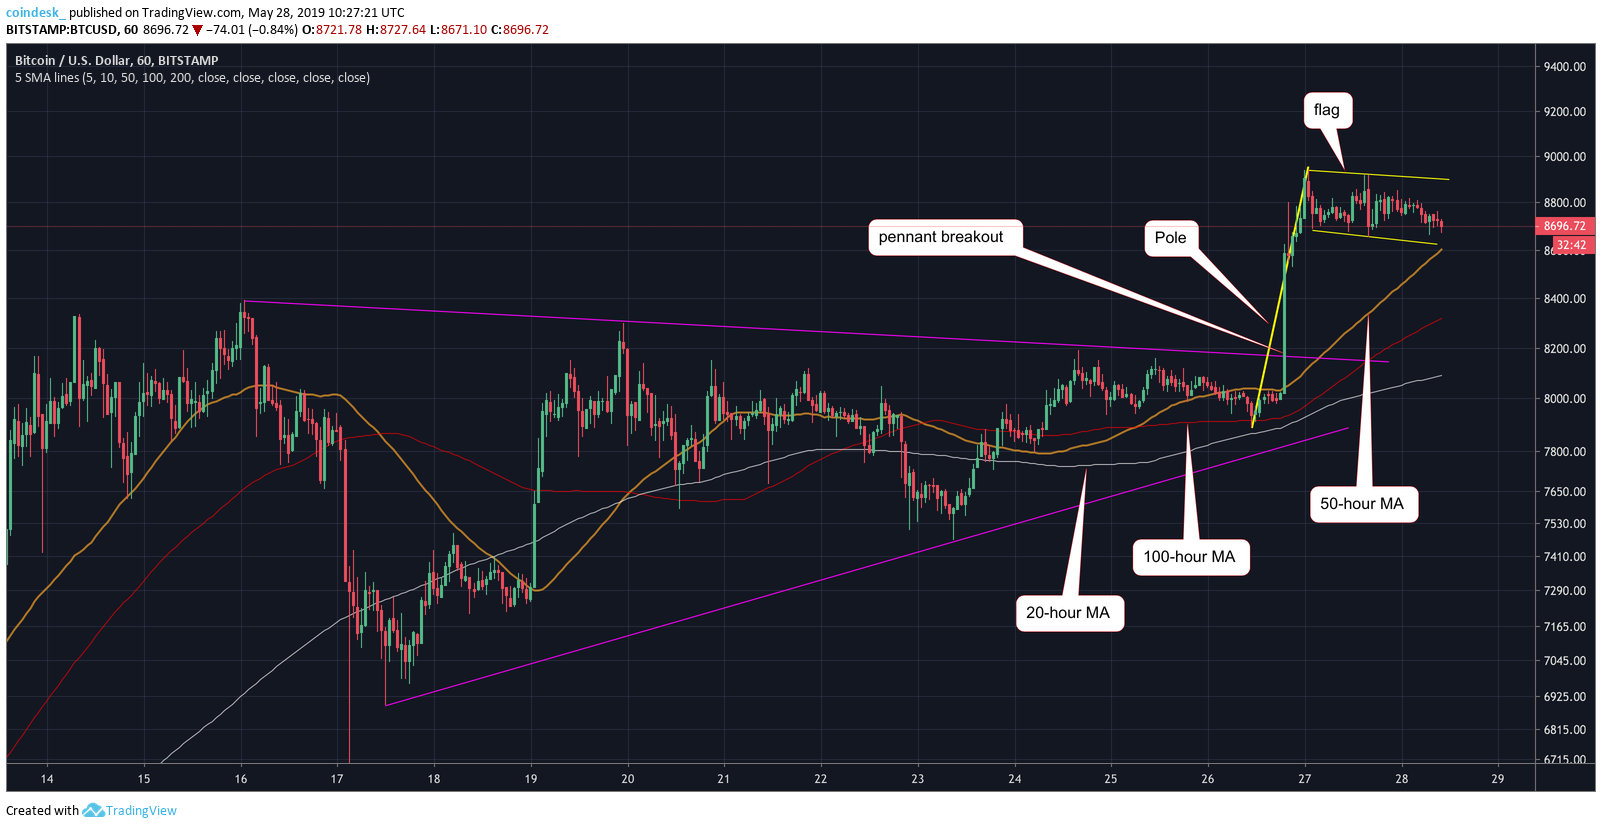
Excuse for the moment one typo on the chart – the “20-Hour MA” should read “200-Hour MA”, but the chart, courtesy of TradingView and the Bitstamp exchange, is an hourly review of the past two weeks for the “BTC/USD” pair. The annotations provided by the analyst are to support his thesis that Bitcoin Bulls are definitely on the run and in control of this market.
Why is it important to establish that a Bull run is in progress? The general line of reasoning suggests that, in order to recover a previous “ATH” or “All Time High”, there needs to be ample momentum and upward pressure, i.e., a Bull run, to blow past resistance and record new record highs. Not everyone agrees that we are there yet, but here are a few technical bits worth your consideration:
- Bitcoin is about to record it fourth straight month of positive gains, “something that only occurs during bull markets”;
• On Sunday, Bitcoin broke out of a converging triangle (wedge, if you prefer) formation, another bullish signal; - A “Pole and Pennant” formation followed, also called a Bull flag, which, according to probabilities in other markets, could signal a strong move upward in over 62% of similar situations – the next significant Fibonacci benchmark would then be $9,942. Amazingly enough, the same “Pole and Pennant” pattern presented itself in the first week of April. Subsequently, BTC bolted up a mere 40% to $8,000 and change;
- Per the analyst: “It is worth noting that the 50-, 100-, and 200-hour moving averages are trending north in favor of the bulls. The stacking order of the 50-hour MA, above the 100-hour MA, above the 200-hour MA is also a classic bull signal.”
Is $10,000 now a certainty, and can we take it to the bank? Hold on… not so fast… BTC has always demonstrated that it has a life of its own and that, in these early stages, it is highly susceptible to price manipulation, when major account balance hodlers (Whales) decide to splash about. Research indicates that Whales are on the move, accumulating “a staggering 450,000 BTC over the past nine months.” According to the latest issue of Diar: “More than one-fourth of all Bitcoin funds are held in “whale” wallets with more than 1,000 BTC each.” History shows that these “hodlers” tend to hold on, not trade.
The Wedge or Pennant pattern has been very prevalent in Bitcoin charts from February forward. For larger wedges on daily charts, as opposed to the above hourly variety, a similar projection exercise leads to a projection of $11,800 as a key future target. This level is significant in that back in January of 2018, Bitcoin dipped below this figure and was never able to regain it again, even after two attempts. An analyst that fastened on this pattern has prophesized that the Bull run will not start until BTC crosses this level.
And so another day of positive forecasts for Bitcoin has come and gone. Analysts seem to be getting their “grooves” back, as they appear to be more confident in their future projections. They have also learned from the past in that each of them attaches a caveat that if BTC falls below a certain level, then all bets are off. For the time being, Bitcoin is hovering around $8,650 with fundamental support for the days ahead. Compared to a year ago, the times are quite interesting indeed.