Datawatch Corporation (NASDAQ: DWCH) today announced the general availability of Datawatch Panopticon 16, their most advanced visual analytics platform for the capital markets industry to date.
The latest version provides faster trading analytics for expedited time-to-insight and addresses the need for real-time and historic views for trading effectiveness.
Exchanges, buy-side and sell-side firms can now quickly integrate real-time streaming, intra-day and historic datasets into HTML5 analytical dashboards for faster and more informed decision-making.
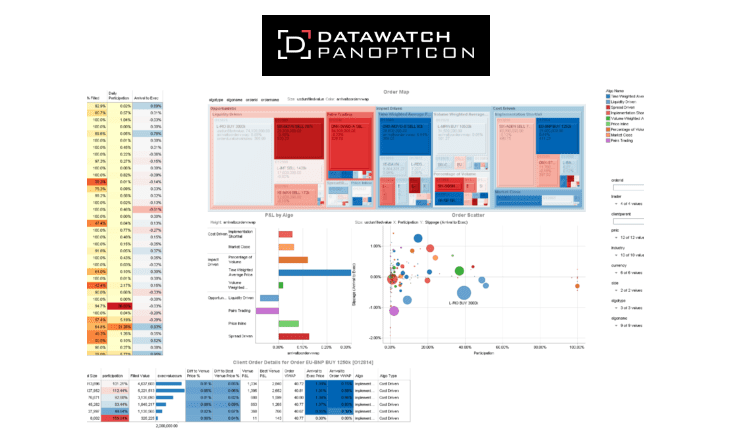
With the new edition of Datawatch Panopticon, e-trading desks can now analyze real-time streaming prices and orders, combined with intra-day and historic data sets, to identify anomalies, trends, clusters and relationships that were previously missed with traditional displays, investigate them and then take informed action.

Peter Simpson VP Visualization Strategy, Datawatch Corporation
Peter Simpson, VP of Visualization Strategy at Datawatch said:
Our significantly advanced analytics capabilities in Panopticon 16 offers up faster investigative analysis, whether pre-trade, real-time flow monitoring during trading, or post-trade analysis. Panopticon customers not only benefit from improved decision making but can also quickly react to changing market conditions iterating analytical displays and publishing to the desk.
Based on customer feedback across trading, risk and compliance desks, Datawatch Panopticon 16 is specifically designed to address the regulatory governance and compliance needs of the world’s largest financial institutions.
Additional key features of Datawatch Panopticon 16 include:
- Support for streaming data — Introduction of HTML5 real-time analytic dashboards
- Improved native connectivity — Enhanced Tick database connectivity, including OneMarketData OneTick and Kx Systems kdb+
- Enriched Big Data connectivity — Expanded Kafka, Cloudera Impala, Spark SQL, Cassandra and Hadoop Hive integration
- Elimination of GUI developer requirements — Design and publication of HTML5 analytics displays by business teams without the need for IT assistance
- Enhanced regulatory governance — Alignment with the regulatory principles of MIFID (Markets in Financial Instruments Directive), MIFIR (Markets in Financial Instruments Regulation) and BCBS239 (Basel Committee of Banking Supervision) for trading, risk and compliance needs
- Scalable modern platform — Enterprise Java server, HTML5 analytical client and web socket communications