This article was submitted by Michael Stark, market analyst at Exness.
Markets have started another week fairly positively as the American fiscal stimulus plan passed in the Senate on Saturday local time. The $1.9 trillion package is now expected to be signed into law by around 14 March. This preview of weekly forex data looks at euro-Aussie dollar (EURAUD), gold-dollar (XAUUSD) and dollar-yuan (USDCNH) and some of the most important releases set to affect these symbols during the week ahead.
There was no significant activity among central banks last week, although Jerome Powell and other senior members of the Federal Open Market Committee have continued to stress ongoing ultra-easy monetary policy to support economic recovery. This week sees the Bank of Canada and the European Central Bank meet, which are likely to provoke some movement for the Canadian dollar and the euro at least in the short term.
This week’s most important regular data are American annual inflation and core inflation on Wednesday afternoon GMT. Given the Fed’s abandonment of clear targets for inflation and commitment to keeping policy very dovish, inflation might continue to be an important driver for commodities like gold and oil but less so for currencies.
Other key figures this week include German inflation and balance of trade, Chinese inflation and Australian sentiment. Politics is expected to remain in focus throughout the week as the American government pushes fiscal stimulus and the meeting of China’s National People’s Congress continues.
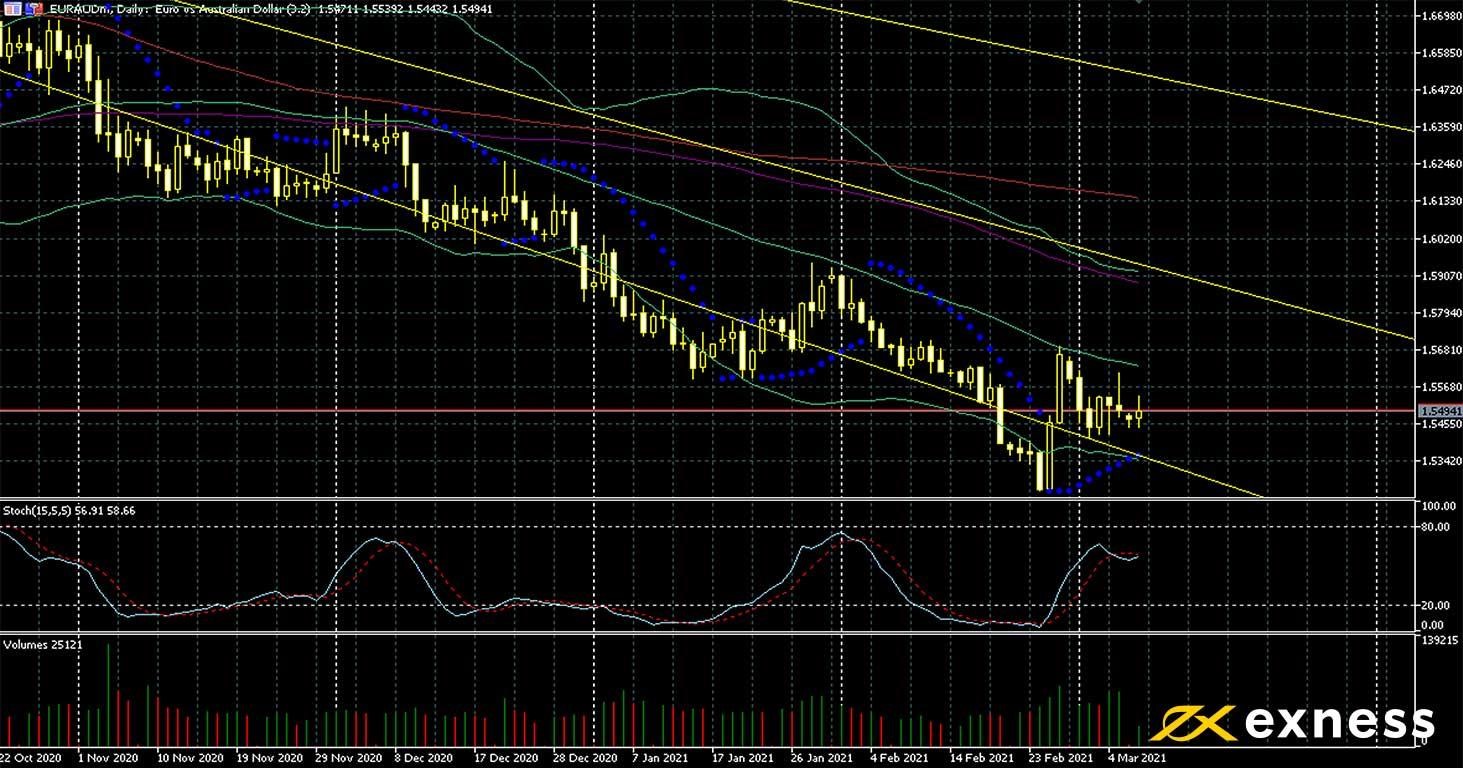
Euro-Aussie dollar, daily
The euro has continued to move downward over the last few weeks against trade-sensitive and ‘risk on’ currencies like the Aussie dollar, although since late last month there haven’t been any new lows. Yields from Australian 10-year bonds have reached highs of nearly two years around 1.75% and the Reserve Bank of Australia remains committed to buying another A$100 billion of government debt over the next few months. Generally speaking, economic recovery looks slightly stronger in Australia than in the eurozone considering data this quarter so far.
This chart’s key technical area since the end of last year has been the 38.2% weekly Fibonacci fan based on the euro’s retreat from March 2020’s high to A$1.61 in late August last year. The first obvious candidate for support over the next few weeks is the next major psychological area around A$1.50. To the upside, each of the moving averages might function as a resistance as the 50 SMA from Bands has done in 2021 so far.
Tomorrow and early Wednesday are likely to be quite active for EURAUD between German trade data and consumer and business confidence in Australia. Apart from these, the general mood in markets might continue moving further toward ‘risk on’ if Chinese and American inflation are perceived as being strong. The ECB’s meeting and press conference on Thursday are unlikely to have a significant effect beyond short-term volatility unless there’s a surprise change of some sort.
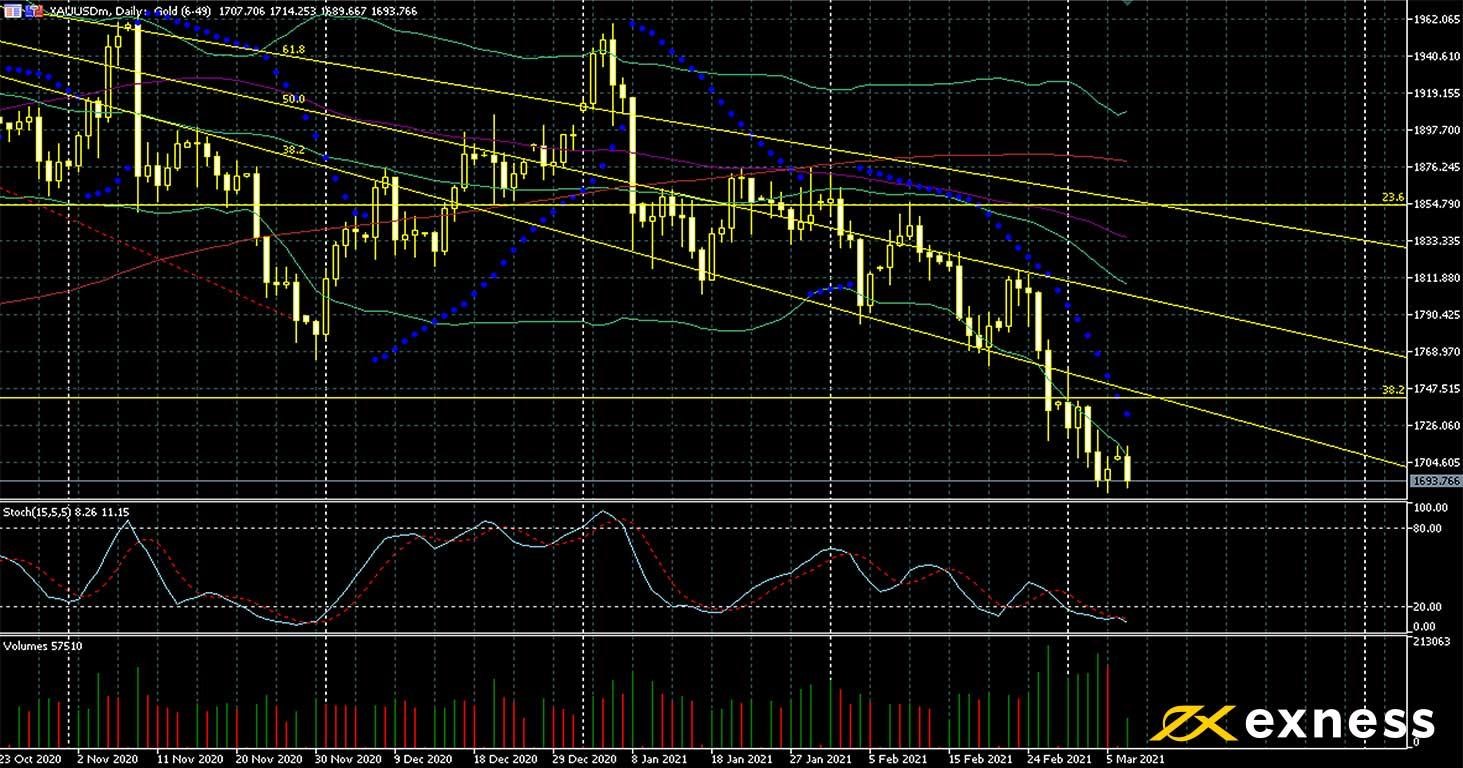
Higher risk appetite has continued to generate headwinds for gold, driving it to fresh nine-month lows after Friday’s positive non-farm payrolls. Now that a significant hurdle in the process of launching new fiscal stimulus in the USA has been passed, one might traditionally expect sentiment on the yellow metal to improve, but this remains to be seen. Last year’s overextension and markets’ shifting attention back to industrial commodities doesn’t look likely to halt in the near future.
Price is now within $40 of the next important support, the 50% weekly Fibonacci retracement area based on last summer’s strong gains. However, there are now very clear oversold signals from both the slow stochastic and Bollinger Bands, so another leg down immediately would not traditionally be favourable. Buying volume has also increased significantly over the last fortnight compared to the average in Q4 2020.
Key data this week
Bold indicates the most important releases for this symbol.
30 GMT: American annual core PPI (February) – consensus 2.6%, previous 2%
30 GMT: American annual PPI (February) – consensus 2.7%, previous 1.7%
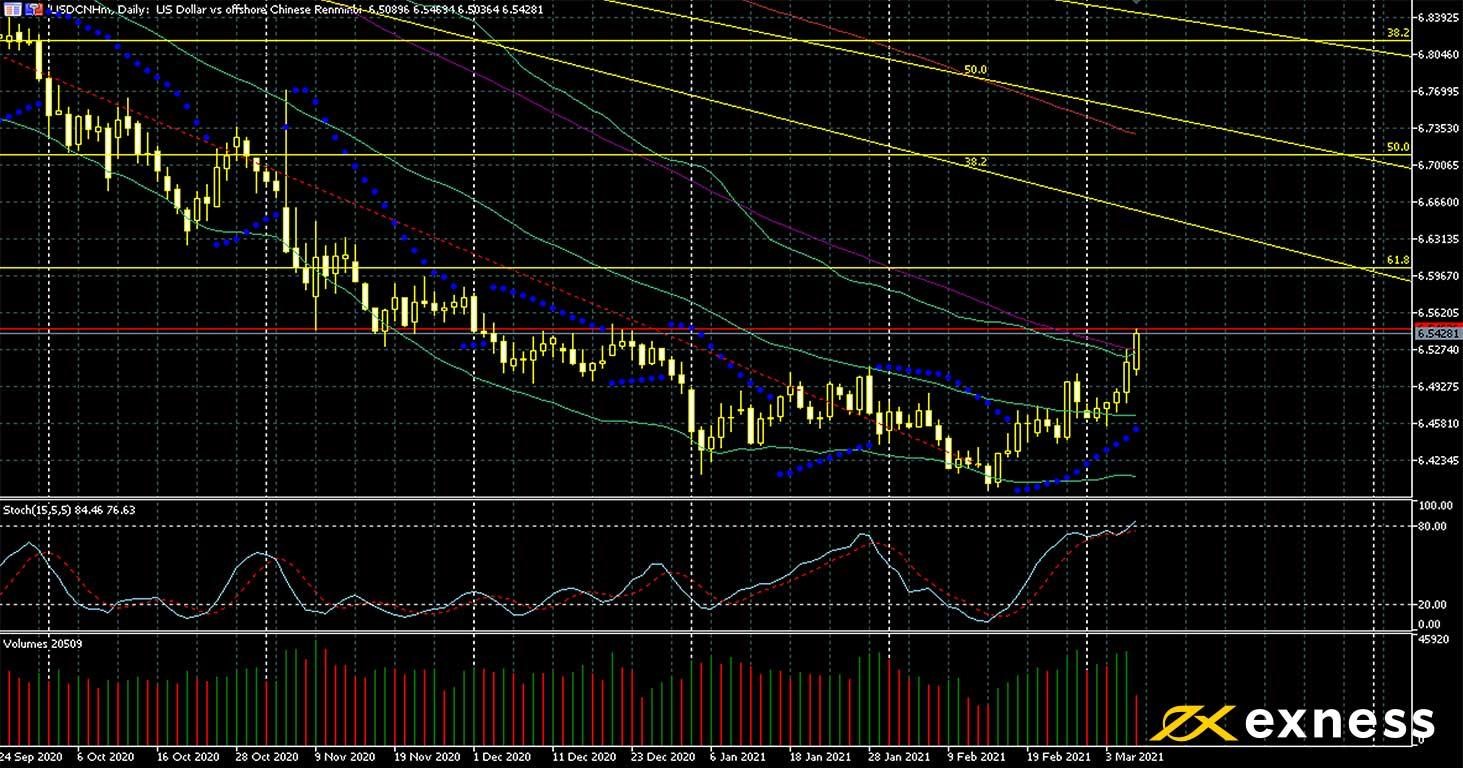
Dollar-yuan, daily
The national lianghui or two sessions in China continue this week, with the National People’s Congress’ (‘NPC’) plenary session in particular bringing with it higher uncertainty than many participants in markets had expected at the beginning of the year. The threat of continuing trade tension between the USA and China and military build ups around the South China Sea plus China’s possible reactions to these might set the tone for havens making gains later in the year.
For the Chinese economy specifically, the latest news of the 14th Five-Year Plan has been positive. Delivering the government’s work report, Premier Li Keqiang announced expectations for annual GDP growth of more than 6%, which is widely considered to be a conservative projection.
With this fundamental context in mind, it seems reasonable to point to the dollar’s recent gains against the offshore yuan (CNH) as being primarily a technical consolidation after a long period of very strong losses. The key area being watched by many traders is the 50% monthly Fibonacci retracement area from the dollar’s gains in 2018 and the first half of 2019. The Fibonacci fan would conventionally be likely to take on a role as a trendline over the next few weeks as well. Finally, there is the ongoing test of the 100 SMA: failure could open the door for another leg down.
Wednesday is likely to be the most active day this week for USDCNH given that both Chinese and American annual inflation are due then. However, it would probably be useful for traders of this symbol to monitor snippets of news from the NPC’s session this week where possible.
Key data this week
Bold indicates the most important releases for this symbol.
Experienced writer and journalist, working in the global online trading sector, Steffy is the Editor of LeapRate. She has previous experience as a copywriter and has been with the company since January 2020. Steffy has a British and American Studies degree from St. Kliment Ochridski University in Sofia.