This article was submitted by Antreas Themistokleous, market analyst at Exness.
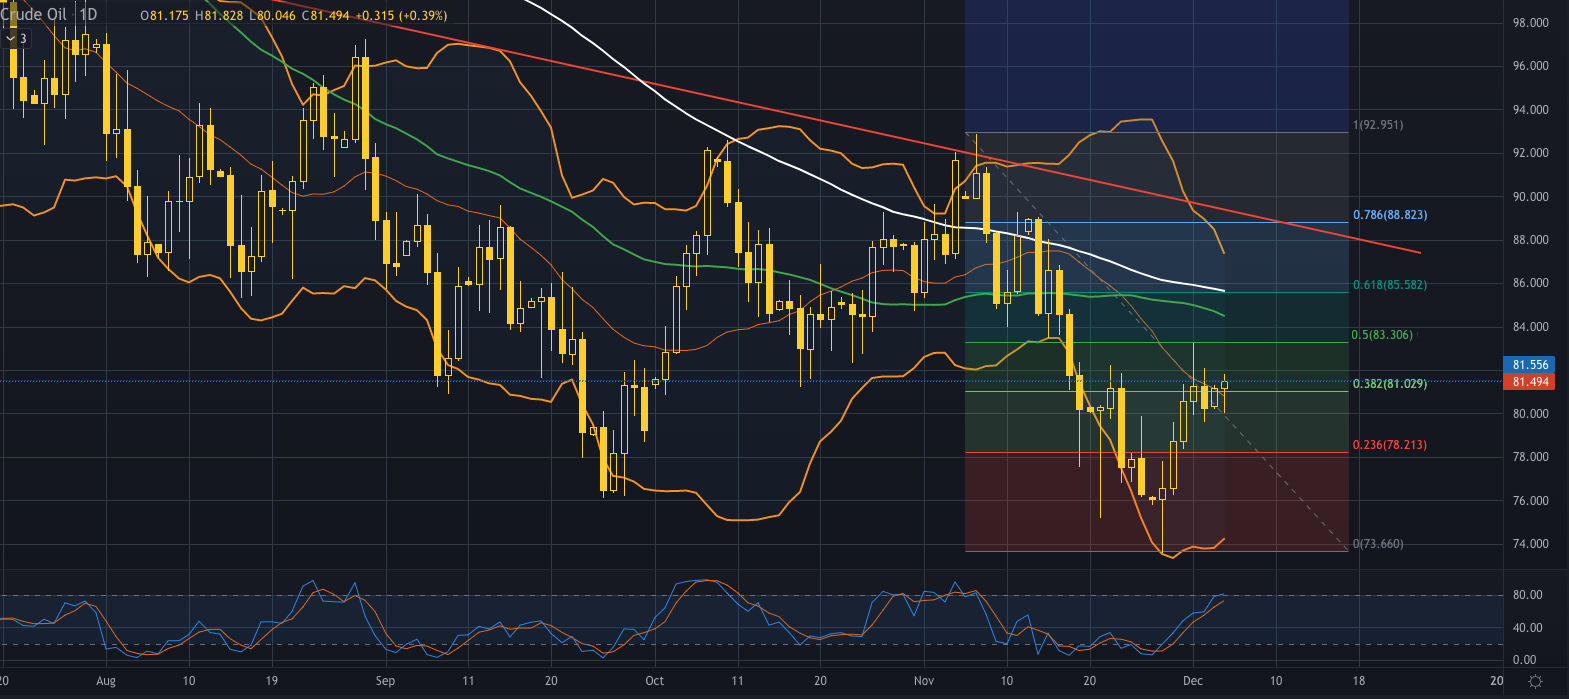
This preview of weekly data looks at USOIL and XAUUSD which are both making some gains in the last week. Gold is trading above its Bollinger bands indicating great volatility in the market while oil is still going strong in its bullish momentum for six out of the last seven sessions.
This week the important publications include the US non-manufacturing PMI which is expected to be more than 50 indicating that the non manufacturing sector of the US economy is growing and might support the buck in the following days.
The Reserve bank of Australia is releasing its monetary policy on Tuesday November 6th at 3:30 AM GMT with market consensus being a single hike on the Aussie dollar. The last 3 times that the RBA increased its interest rates we see that the Australian dollar was supported well at least in the short term so it’s no surprise to witness this support after the publication this time also.
On Wednesday November 7th at 12:30 AM GMT we also have the Australian GDP release with the expectations being more than optimistic with the figure reaching up to 6.3% against a previous release of 3.6%. If this figure is confirmed we might see the Aussie dollar making gains against its pairs.
On the same day at 3 PM GMT we have the Bank of Canada releasing its monetary policy where a double hike is the most possible scenario. If this scenario plays out then we might see some upward movement of the loonie against its pairs especially the US dollar.
Last important news for the week is the Australian Balance Of Trade set to be released on Thursday at 12:30 AM GMT which is expected to have an increased trade surplus further supporting the Australian Dollar.
Gold, daily
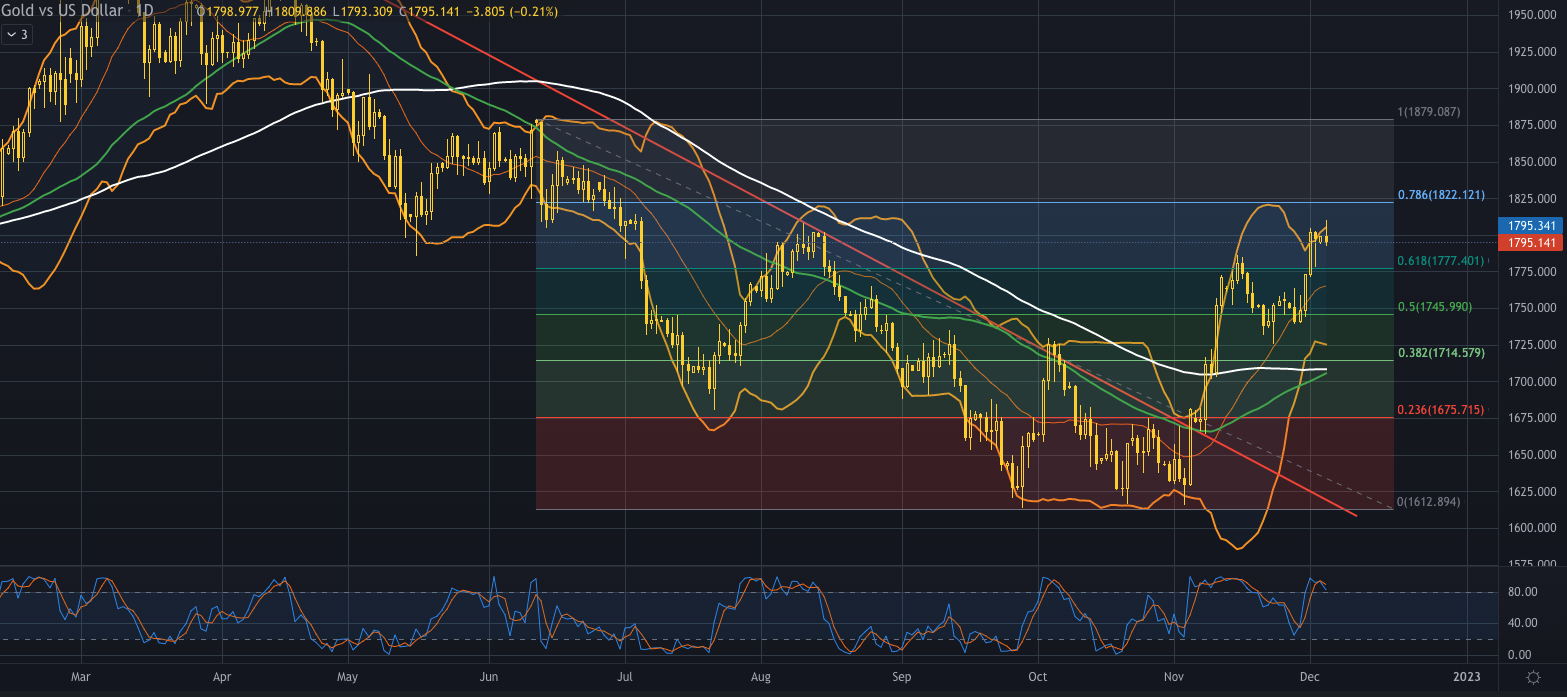
Gold prices hit a 5 month high on Monday with the price reaching $1,809.91. Recession fears in the US were lowered for the time being since the US job report got published last Friday and showed that U.S. employers hired more workers than expected in November with the NFP reporting an addition of 263 thousand jobs against market expectations of 200 thousand. Even though the actual figure is less than the previous release it is still a positive figure signaling that the labor market is still keeping strong in the States. The market is also expecting the Federal Reserve to slow their pace on the next FED meeting with 80% expecting a double hike instead of the last triple hike which could potentially provide support for gold.