
The following article was submitted by Michael Stark, market analyst at Exness.
Probably the biggest event so far this week in markets is the huge slump in the price of major benchmarks for crude oil. Stock markets so far are facing their worst day since the Global Financial Crisis in 2008.
Japanese GDP data late last night indicated a decline of around 7.1% in annual GDP, around half a percent worse than the consensus and in sharp contrast with the previous upwardly revised 0.1% growth. German trade balance though has yet to display much effect from the spread of the coronavirus.
Central banks were highly active last week, with many cutting rates in emergency moves. The most notable of these was the Fed’s 0.5% cut. The Bank of Canada and the Hong Kong Monetary Authority also cut half a percent and the Reserve Bank of Australia 0.25%.
Data is very likely to take a backseat to general chaos in markets this week. Indeed, Friday’s good NFP barely had an impact on the dollar, which has been in crisis mode since the middle of last week.
Brent, four-hour
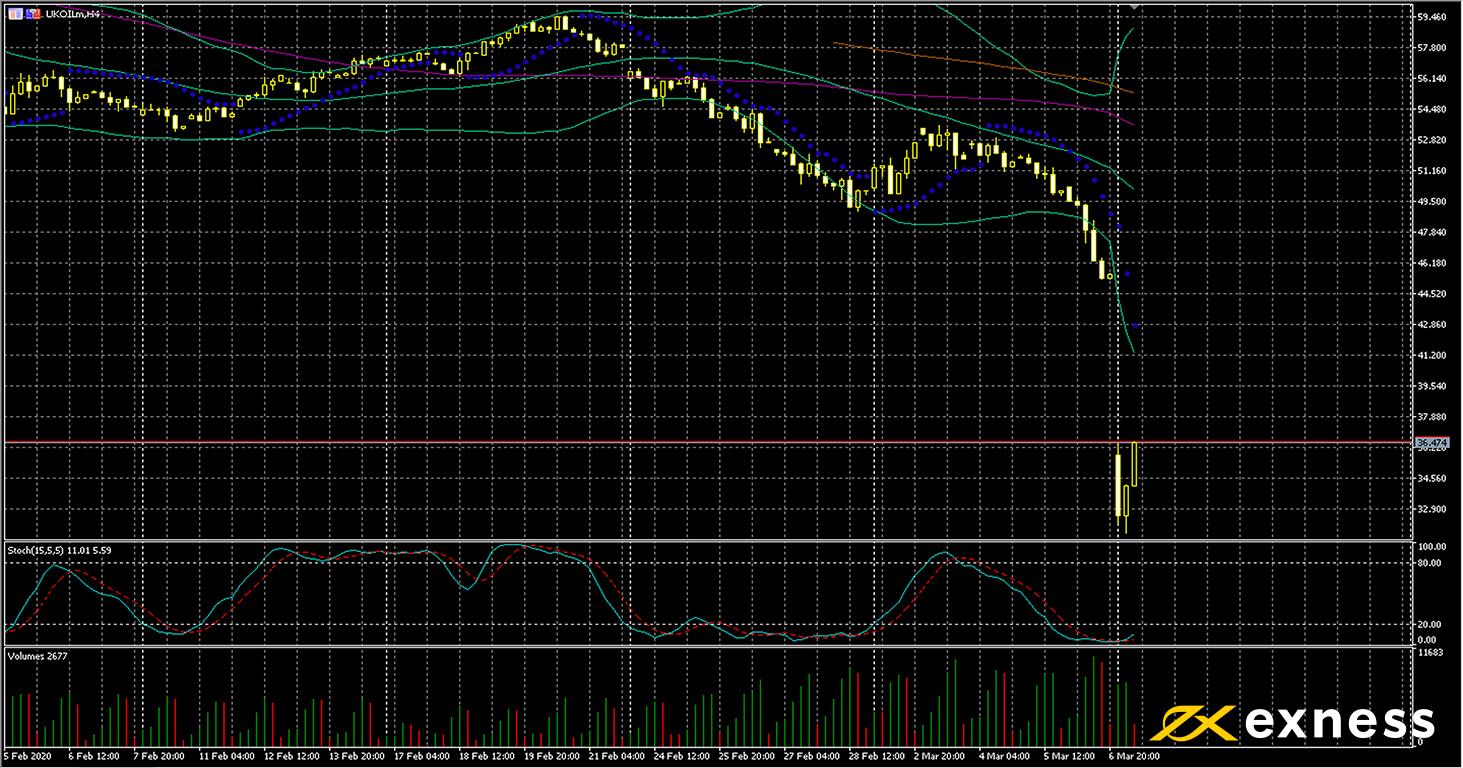
Crude oil featured one of the biggest gaps downward over the weekend of any major CFD instrument, with a loss of around 30% since Friday night for both UKOIL and USOIL. In this case, the coronavirus is basically old news: China seems to have the virus under control relatively speaking. The big unknown for crude is how OPEC+ might eventually agree to drive prices up, and indeed whether the cartel and its allies could reach agreement. The first signs of a selloff came on Friday when Russia and OPEC failed to agree even on extent current cuts to output, let alone cutting an additional 1.5 million barrels daily as some in OPEC had hoped. Saudi Arabia has now slashed its official price for crude and ramped up production.
Brent has fallen around 30% from Friday’s close. Of course, this isn’t to say that it couldn’t fall another 30% from where it currently is this week, but such a situation seems to be unlikely. The unusual situation of such a divergent opening plus stochastics persisting close to zero and Bands about $5 above the current price would mean that the current retracement is likely to continue for a couple of periods at least. Buying volume over the first two periods today also remains high.
Key data points
- Tuesday 10 March, 20.30 GMT: API crude oil stock change – previous 1.69/million
- Wednesday 11 March, 14.30 GMT: EIA crude oil stock change – previous 785,000
- Wednesday 11 March: OPEC’s monthly report
Gold-dollar, four-hour
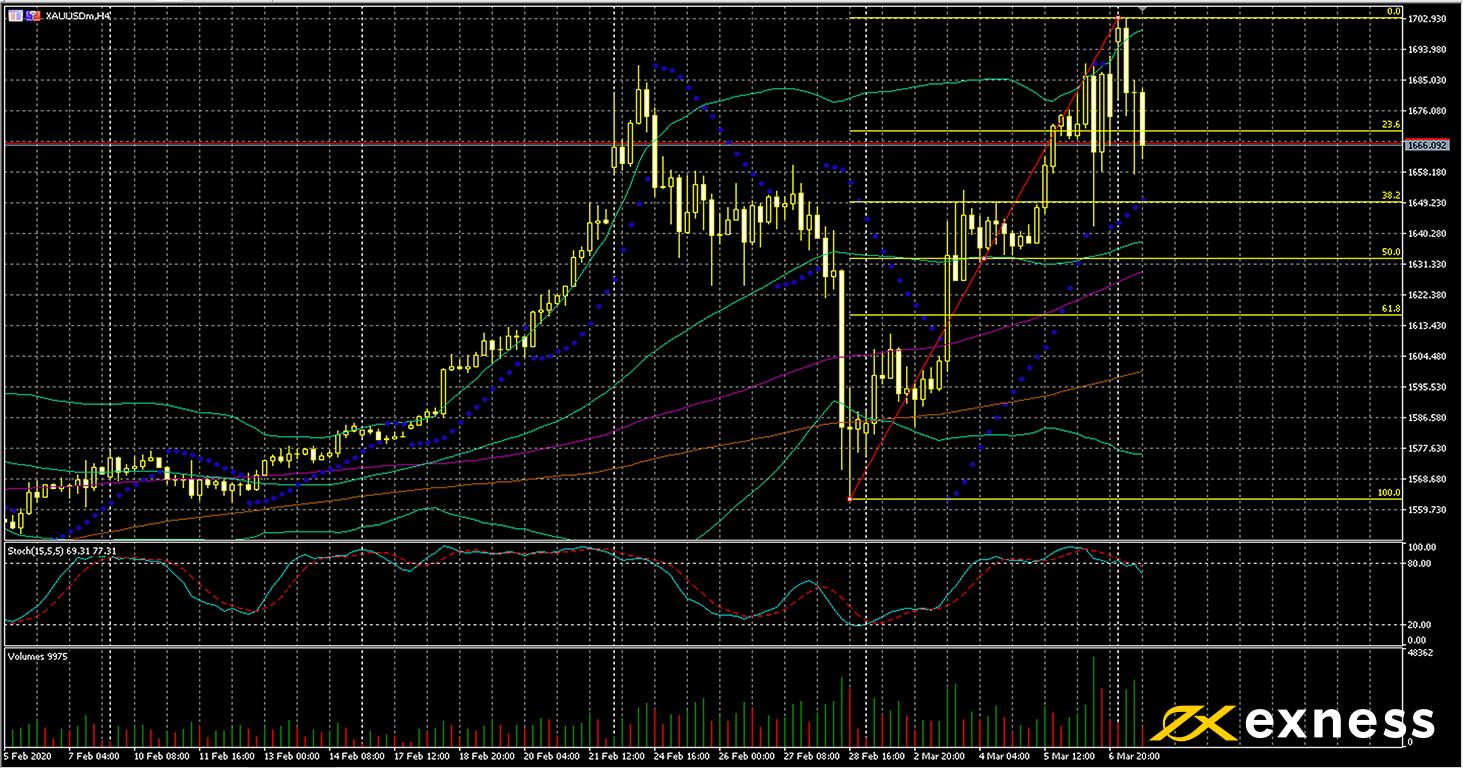
XAU-USD’s movements have been more chaotic than many instruments recently. This morning’s high slightly above $1,700 is the highest price in over seven years for spot gold. Panic in stock markets and a general flight to havens has sustained demand for the yellow metal since the end of last week. On the other hand, margin calls affecting large accounts appear to have led to the high level of choppiness seen so far today.
Price has recently emerged from overbought based on Bands and the stochastic. As yet, though, there’s been no sustained move below the 23.6% Fibonacci retracement area. Buying volume has remained quite high since Friday night GMT. Aggressive buyers might either enter here or wait for a bigger retracement; more sensible traders might instead wait until price action calms down somewhat later in the week or Wednesday’s inflation data from the USA contribute to a clear ongoing direction.
Key data points
Bold indicates the most important releases for this symbol.
- Wednesday 11 March, 12.30 GMT: American annual core inflation (February) – consensus 2.3%, previous 2.3%
- Wednesday 11 March, 12.30 GMT: American annual inflation (February) – consensus 2.2%, previous 2.5%
Euro-dollar, four-hour
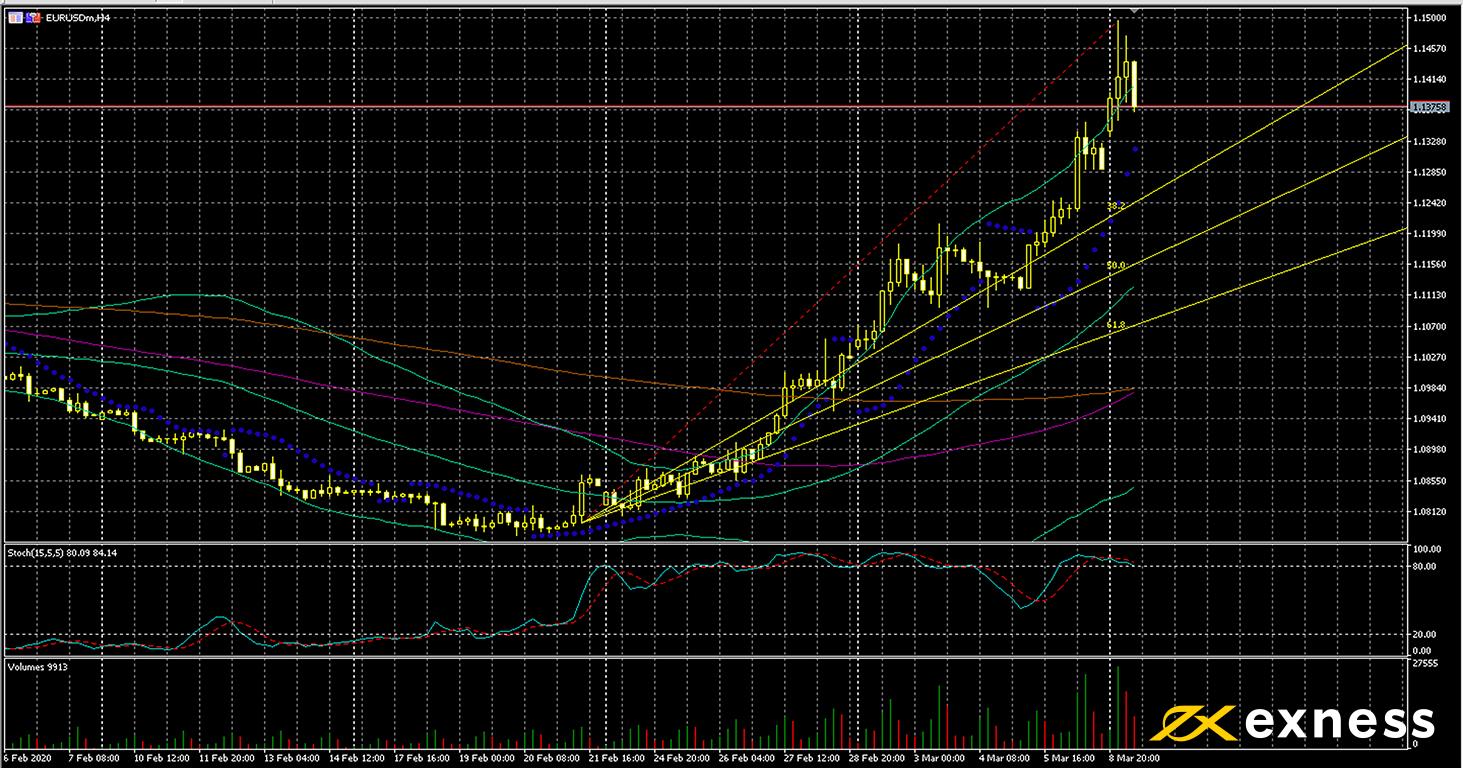
Another unusual chart so far this week is EUR-USD, with growing fears of a full-blown recession and the American government’s generally feeble response to the coronavirus driving big gains for the euro here. The Fed’s emergency cut to rates was also a key factor last week.
As for crude oil, a retracement sooner or later seems to be favourable here. The first key area to the downside is probably the 38.2% zone from the Fibonacci fan. Having said that, fundamentals are likely to continue their dominant importance this week. What, if anything, the ECB does on Thursday (or possibly before that) to mitigate the effects of the coronavirus on the eurozone will be key. American data could also be crucial for ongoing direction this week.
Key data points
Bold indicates the most important releases for this symbol.
- Tuesday 10 March, 10.00 GMT: eurozone annual GDP growth (Q4, third estimate) – consensus 0.9%, previous 1.2%
- Tuesday 10 March, 10.00 GMT: eurozone annual employment change (Q4, final) – consensus 1%, previous 1%
- Wednesday 11 March, 12.30 GMT: American annual core inflation (February) – consensus 2.3%, previous 2.3%
- Wednesday 11 March, 12.30 GMT: American annual inflation (February) – consensus 2.2%, previous 2.5%
- Thursday 12 March, 12.45 GMT: ECB’s meeting
Disclaimer: opinions are personal to the author and do not reflect the opinions of Exness or LeapRate.