This article was submitted by Antreas Themistokleous, market analyst at Exness.
This preview of weekly data looks at EURUSD and XAUUSD where both are making bearish corrections since the US Dollar Index is trading in a slightly bullish movement.
The first important event on the economic calendar for this week is the Canadian Inflation rate tomorrow at 13:30 GMT. Market consensus is for a decline of around 0.2% reaching 6.1% for the month of January.
US housing market related data (existing home sales and new home sales) on Tuesday and Friday at 15:00 AM respectively. The market expectations are for a slight increase in both figures with an additional 800 thousand and 3 thousand respectively which might have very minor gains on the Dollar, if any.
Reserve Bank of New Zealand interest rate decision on Wednesday at 01:00 AM GMT. Currently the most possible scenario is for a double hike which if confirmed could generate some profits for the currency at least in the short term.
Most important publication for the week – FOMC minutes on Wednesday at 19:00 GMT. The possibility of a double hike in the next FED meeting is gaining some ground in recent weeks climbing up to 18.1%. Traders attention is focused on this publication which most probably will create some volatility on all USD pairs.
European Inflation rate on Thursday at 10:00 AM GMT. The market is expecting a drop on the figure of around 0.7% possibly signaling that the European Central Bank’s stance on hiking interest rates might slow down creating some losses on the Euro against its pairs.
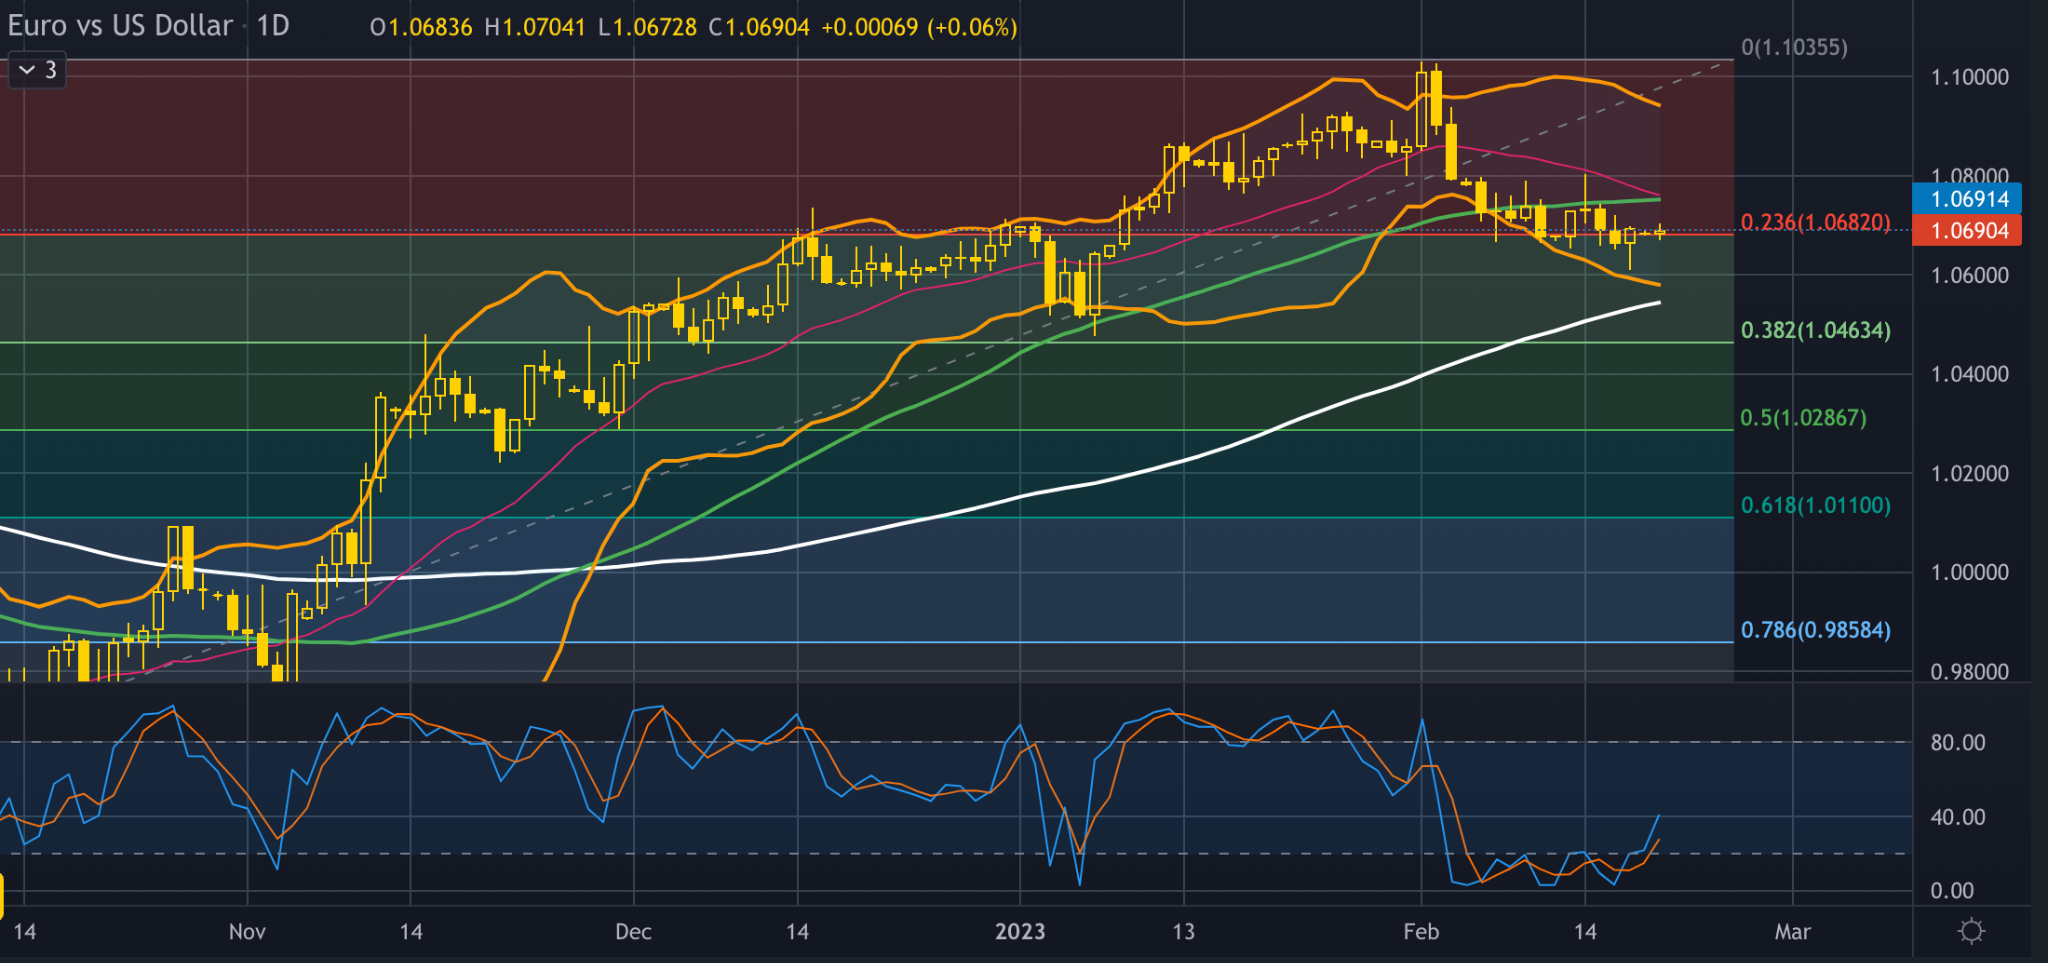
EUR-USD, daily
With investors anticipating economic data both from the Euro Area and the US FOMC minutes and also the US markets closed on Feb. 20 for President’s day the volatility on the fiber chart will most probably be thinner than usual. The price on the daily chart is making losses for the Euro since the Dollar Index is growing stronger with a reading of 104 at the time of this report.
On the technical side the price on the fiber chart has found support on the 23.6% of the daily Fibonacci retracement level without being able to make a valid break below it for the time being. With the Stochastic oscillator near the extreme oversold level and the 50 day simple moving average trading above the 100 day simple moving average one can deduce that the overall sentiment is bullish at least for the short run. If the bulls are proven to be stronger than the bears then we might see a correction to the upside with a first point of resistance being around the $1.07600 area which consists of the cross between the 20 and the 50 day moving averages.
In the event that the price manages to break below the 23.6% of the Fibonacci and the declining trading channel continues to be valid then we might see some support around the $1.05 area which is made up of the 100 day moving average, the lower band of the Bollinger bands and just above the 38.2% of the Fibonacci.
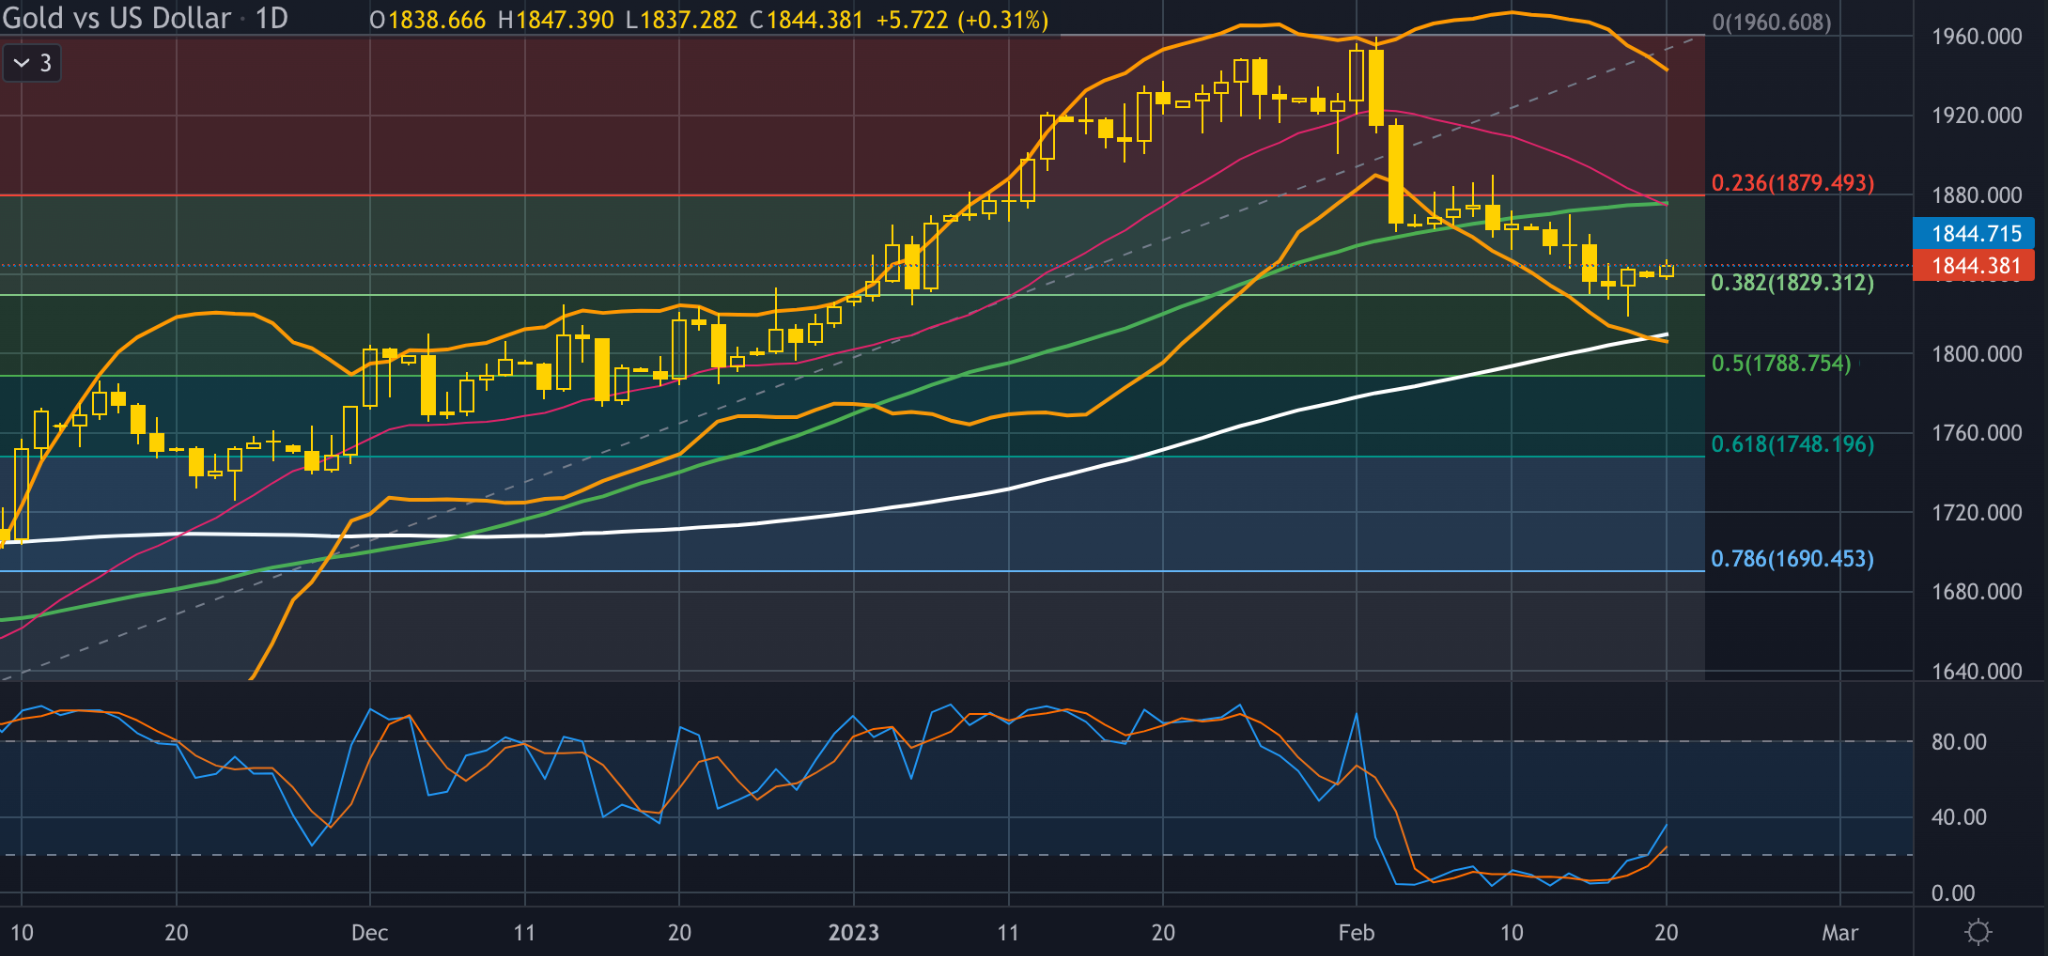
Gold-dollar, daily
After recent economic data showed signs of a strong U.S. economy with higher consumer prices, a rebound in producer prices and a tight labor market which sparked concerns that the Fed would keep interest rates higher for longer the price of gold got “stuck” in a tight range in the opening of the week. The price of the “yellow metal” is already at a 6-week low and trading just below the psychological round number of $1,850. Investors and traders are looking forward to the FOMC minutes on Wednesday to get hints on the near future FED policy possibly resulting in the continuation of the trading range on gold in the following sessions.
From the technical point of view the price is trading just above the technical support of the 38.2% of the daily Fibonacci retracement level while the psychological resistance of the round number $1850 is very close to the current level. The Stochastic oscillator is near its extreme oversold levels while the 50 and 100 SMAs are indicating a bullish momentum in the market for gold. In the event that a correction to the upside is seen then the first point of resistance could possibly be around the $1,880 price area which is a very strong resistance level since it consists of the combination of the 20 and 50 day moving averages and also the 23.6% of the Fibonacci.
On the other hand if the price moves South then we might see some support area around $1,800 which is just above the 50% of the Fibonacci retracement , the 100 day moving average, the lower band of the Bollinger bands and also the psychological support of the round number.
In the beginning of February activity in markets was generally low so as participants looked to key meetings of central banks and Friday’s job report from the USA. Read more…
Disclaimer: opinions are personal to the author and do not reflect the opinions of Exness or LeapRate.
Experienced writer and journalist, working in the global online trading sector, Steffy is the Editor of LeapRate. She has previous experience as a copywriter and has been with the company since January 2020. Steffy has a British and American Studies degree from St. Kliment Ochridski University in Sofia.