Weekly data: EURUSD & GBPUSD price action early in the week before economic data

This article was submitted by Antreas Themistokleous, market analyst at Exness.


This preview of weekly data looks at EURUSD and GBPUSD where economic data and the general financial situation in the banking industry are the main drivers in the markets for the time being.

The most important economic data for this week are:

  1. Preliminary German inflation rate on March 30th at 12:00 PM GMT. The current rate of 8.7% is a 60 year high while market expectation is for a drop to 7.3%. As the largest economy in EU the German data affect the Euro overall so if the consensus is confirmed we might see some minor losses on the Euro at least in the short term.
  2. Flash European inflation rate on March 31st at 09:00 AM GMT. The figure is expected to slightly decrease by 1.3% which could possibly influence a more dovish stance by the ECB on the May 4th meeting therefore creating minor losses for the Euro.
  3. European unemployment rate on March 31st at 09:00 AM GMT. The market is not expecting any changes in this figure for the month of February while the figure remains relatively unchanged for the last year.
  4. US personal income and personal spending on March 31st at 12:30 PM GMT. The expectations are for a drop of 0.3% and 1.5% respectively. This publication for the month of February might indicate that future inflation rates might be declining since consumers show reduced income and subsequently lower spending which might eventually lead up  to lower inflation rates in the coming months.
  5. German unemployment rate on March 31st at 07:55 AM GMT. Similarly to the European unemployment rate the market is not expecting any changes in this figure for the month of March and the figure is also constant without any major fluctuations in the last 8 months.

EURUSD, daily

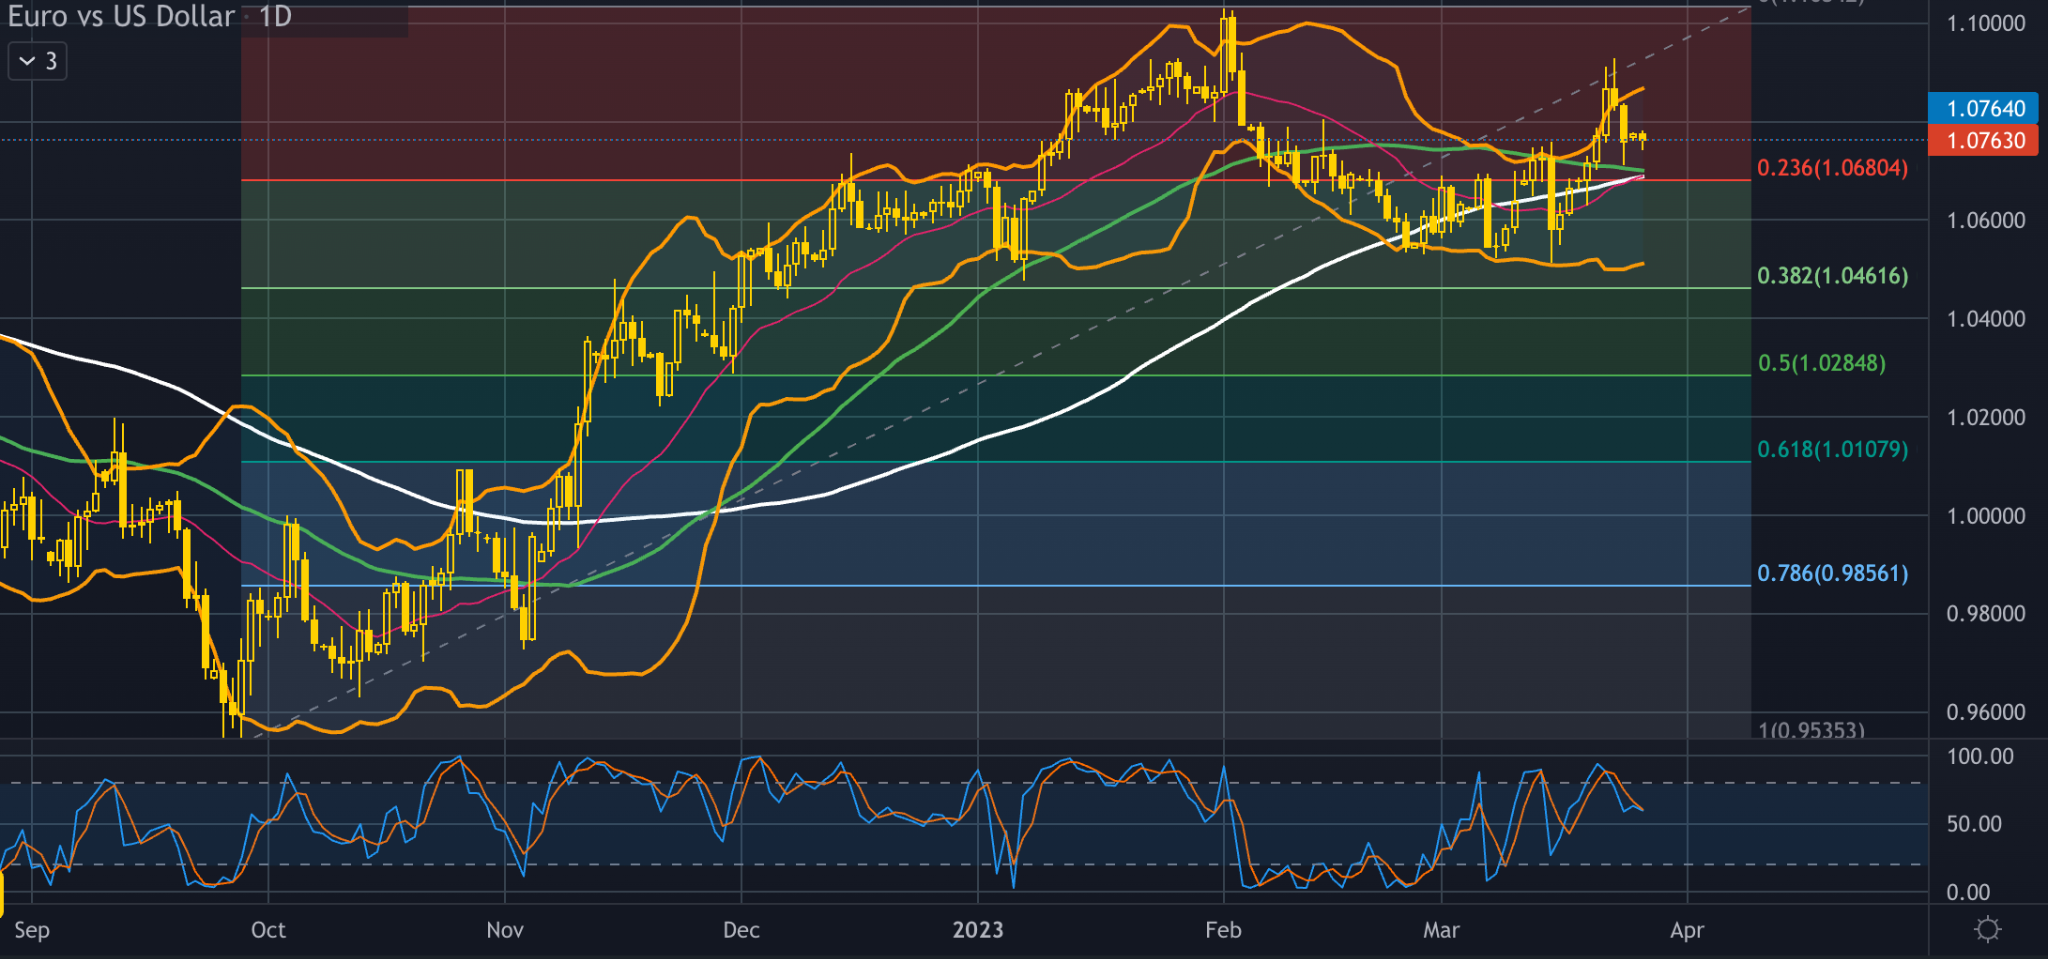
This would likely be a busy week for the Euro with economic data being released from Germany and European inflation and unemployment rates. On Thursday, German inflation figures for March will kickstart the investors interest ahead of a busy Friday session. After an aggressive bullish rally for the Euro against the Dollar in the last quarter of 2022 until early February 2023 the price has corrected to the downside with some minor gains seen in the last couple of weeks. This week’s data is expected to create some volatility on the Euro pairs with many eyes being set on the “Fiber” chart. Friday being the busiest day in terms of data , investors and traders would pay attention to the figures of inflation and unemployment rates coming from Germany and the European Area while investors would also monitor ECB member speeches throughout the week. ECB Executive Board members Frank Elderson, Isabel Schnabel, Andrea Enria, and ECB President Christine Lagarde are due to speak.

On the technical side the price on the fiber chart has found resistance on the upper band of the Bollinger bands last Thursday “forcing” it to correct around the $1.07600 area which is trading at the time of this report. The Bollinger bands are expanding indicating volatility build up which is expected to peak for this week around publication hours on Friday. The Stochastic oscillator is not indicating any extreme overbought or oversold levels while in the event of a short term correction to the downside we could possible expect some support around $1.069800 area which consists of a point on the chart where it combines all technical indicators of the 20,50 & 100 moving averages as well as the 23.6% of the daily Fibonacci retracement level.

GBPUSD , daily

Even Though this would be a quiet week for the British pound with no economic indicators for the investors to consider, the daily chart possesses some interesting facts on the daily chart which will be analyzed below.  Last week the British inflation rate cae in hotter than expected at 10.4% with the consensus at 9.9% while the Bank of England raised interest rates by 25 basis points reaching at 4.25%. These data could be translated into the narrative that the possibility of further interest rate hikes from BoE is still very high.

From the technical standpoint the price is trading in a sideways channel for the last three months with $1.24500 & $1.18000 being the upper and lower levels of the channel respectively. The price was touching the upper band of the Bollinger bands for a whole week before moving away in recent sessions. This is usually but not always considered to trigger a correction on the charts. Even Though this correction is not yet seen on the daily chart there are also other indications of this scenario.

The Stochastic oscillator is in the extreme overbought area while the Bollinger bands are expanding indicating volatility is still high in the market. If this is the case and we see a downward correction on the cable chart then the price might find support on the strong technical area of $1.21300. This area is made up of the 20,50 and 100 day moving averages and is also just above the daily Fibonacci retracement level of 23.6%. For this to play out the price needs to break below the psychological support of the round number at $1.22. In the other hand if we see a continuation to the upside we might see resistance building up around $1.24 which consists of the inside resistance area since early February 2023, the upper band of the Bollinger bands as well as the psychological resistance of the round number.


Disclaimer: opinions are personal to the author and do not reflect the opinions of Exness or LeapRate.

Read Also: