ActivTrades’ Market Analysts prepared their daily commentary on traditional markets for April 21, 2020. This is not a trading advice. See details below:
FOREX
The plight of crude oil yesterday painted the most vivid illustration so far of the havoc being reeked in financial markets by the economic fallout from the coronavirus. The US dollar emerged as one of the ‘winners’ in this unprecedented situation, becoming the clear choice for investors when turbulence and uncertainty take over. The Dollar Index climbed more than 0.3% during the early part of Tuesday’s session, gaining ground against other currencies in a clear safe-haven trade by concerned investors, as market sentiment turned bearish following the plunge of the May contract of WTI crude oil to negative prices. In the current environment more greenback gains are likely.
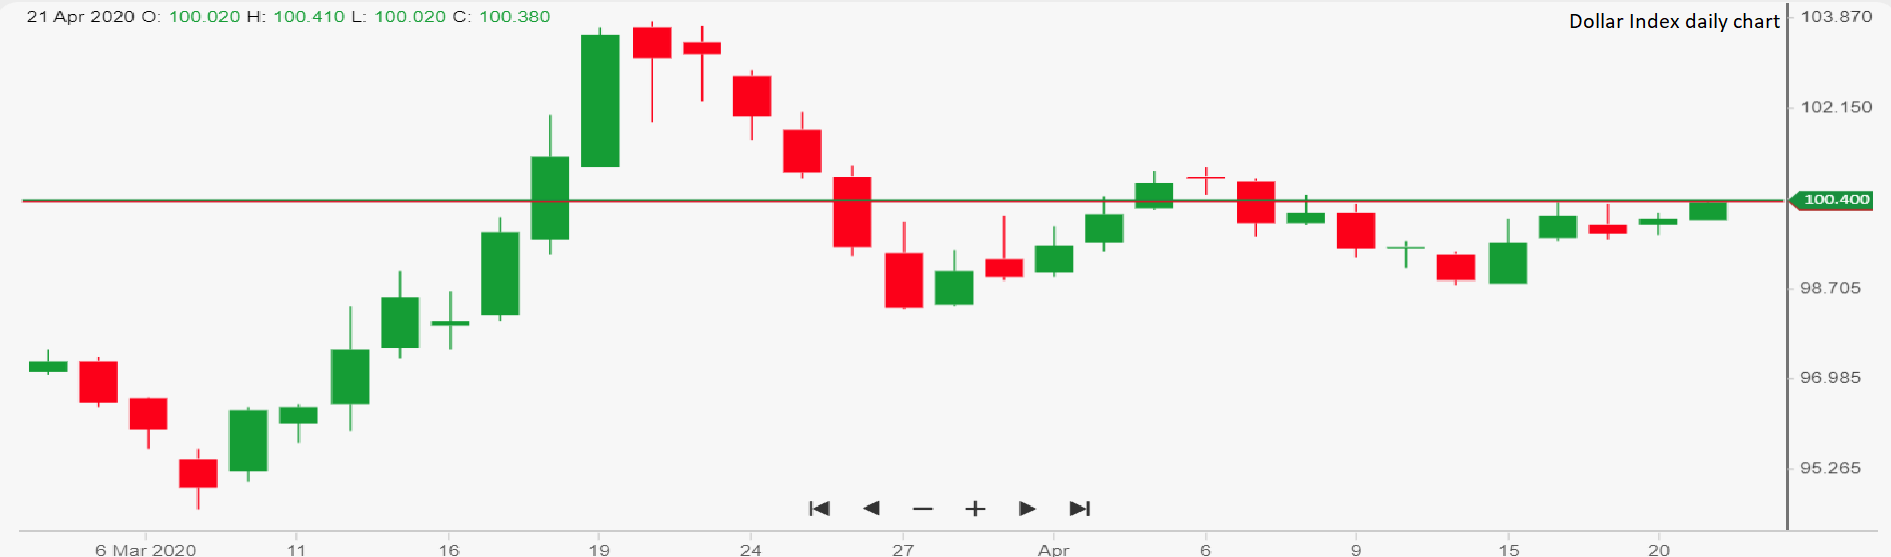
Dollar Index
Ricardo Evangelista – Senior Analyst, ActivTrades
OIL
The price of crude oil has plunged, sinking to levels not seen in this millennium. For the first time ever, we have seen the price of WTI (expiry of May) fall into negative territory.
The mix of two black swans, namely the tragic spread of coronavirus and the missed agreement between OPEC+ has been the trigger for this dramatic collapse. Even though the producers’ alliance did finally reach an agreement earlier this month for a cut of 9.7 million of barrels a day of production, the oil price has crashed further still. The deal was simply not enough with analysts estimating a fall on the demand side of close to 30 million barrels per day, three times the cut reached by OPEC+.
Although Brent has fallen noticeably, the collapse has been even more dramatic for WTI, the benchmark for US oil, with the May contract dropping below $0 a barrel, plummeting to an incredible -$40.32 at its most extreme. Oil has become so unwanted that traders were simply paying to not receive physical delivery of crude.
However, with the May contract having now expired, the sharp contango in the market has seen the price to increase again. On CME, the June WTI contract is already trading at $21.22, while July it is just below $27. If we look further out to September, the price is even higher and is above the psychological threshold of $30.
This huge contango is driven by the enormous oversupply that is drowning prices in the short term. Some of this surplus should start receding in the medium to long term once the global lockdown, which has effectively turned the tap off on demand, eases. Another factor to add into the mix are storage costs, which are particularly high in this scenario with the majority of tanks already full.
Therefore, any investor seeking to take a position on oil, be that on futures, CFDs or EFTs, must factor in all these considerations and fully understand the implications of contango on prices before taking the plunge in these dramatic times.
Carlo Alberto De Casa – Chief analyst, ActivTrades