USD/CAD has plunged 2.5% from May 5th to 24th caused by rising oil prices.
The trend has turned to an upswing since May 24th helped by a slump in oil prices after the recent OPEC meeting.
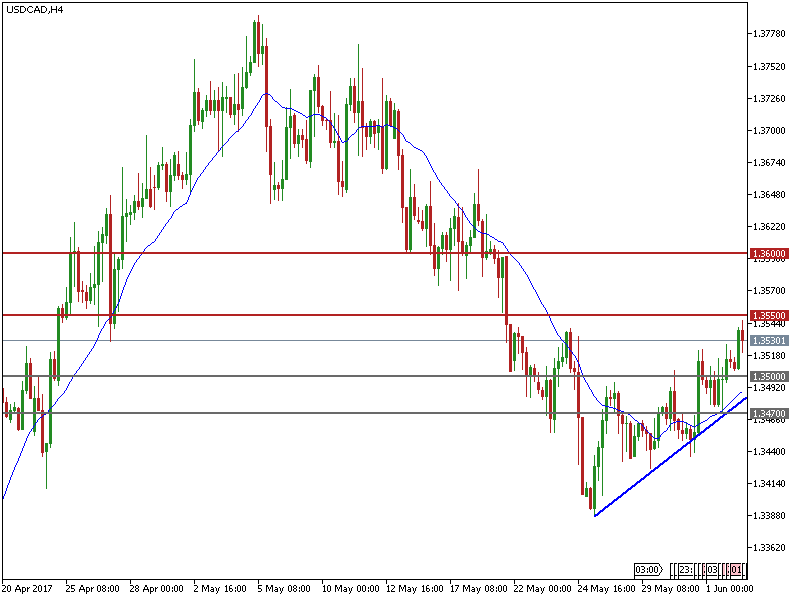
On the 4-hourly chart USD/CAD has turned bullish, trading above the downside uptrend line support.
This morning USD/CAD hit a 2-week high of 1.3546.
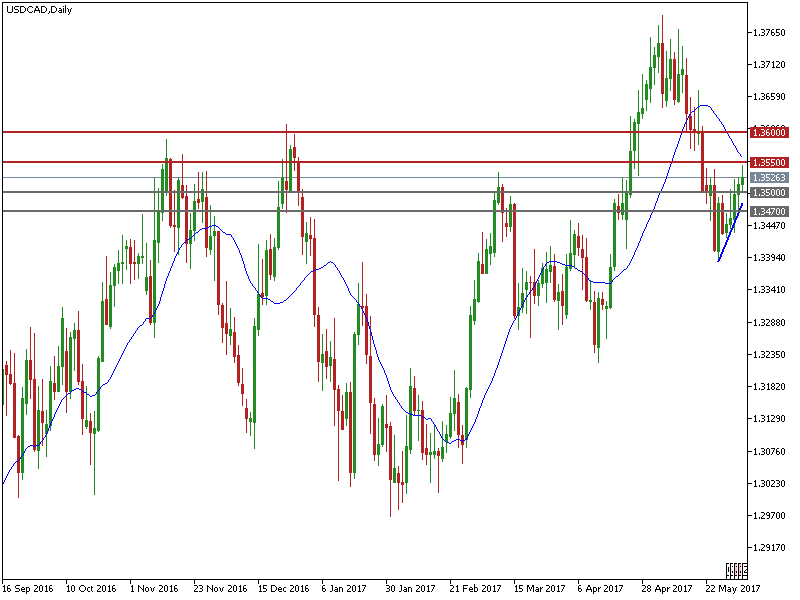
Currently, on the daily chart, the price is approaching the long-term major resistance zone between
1.3550 – 1.3600, where also the 20-day SMA is situated (1.3560).
The bulls still have momentum, however, be aware that the selling pressure is heavy at this zone.
The resistance level is at 1.3350 followed by 1.3600.
The support line is at 1.3500 followed by 1.3470.
The crucial US labour market data for May will be released today, June 2nd at 13:30 BST. It includes non-farm payrolls, unemployment rate and average hourly earnings.
Please note that the release of US labour market data will likely cause volatility for USD/CAD and other USD crosses.
Be aware that, based on prior experience after the release of the data, market trends sometimes reverse within 1-2 hours after the initial move.