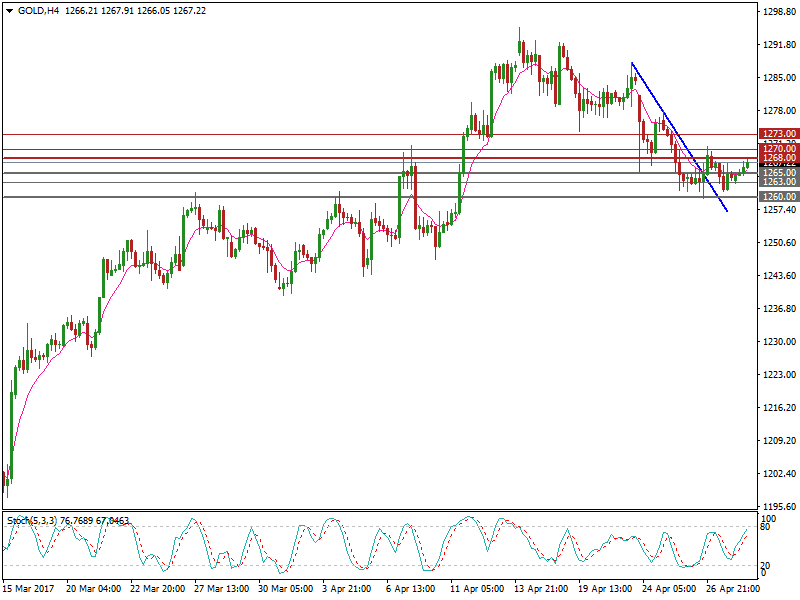
Spot gold has seen a 1.56% retracement over past two weeks after hitting its highest level of 1295.37 last seen on November 9th 2016. That said, this retracement has held above the support line at 1260 over the past two days.
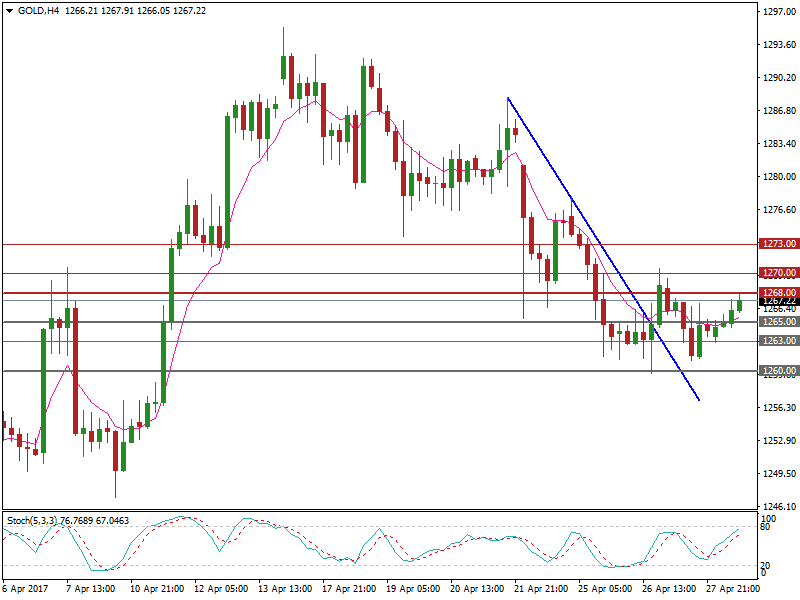
On the 4-hourly chart, the price broke the downtrend line resistance on April 26, indicating bullish momentum has been increasing.
The daily Stochastic Oscillator reading is below 30 suggesting a rebound.
US Q1 GDP annualized initial reading, Q1 PCE and Q1 core PCE inflation figures (QoQ) will be released at 13:30 BST today. This will be the first US GDP figure reported since Trump took office.
During the early European session this morning USD has weakened ahead of the release of Q1 GDP as markets are expecting the figure will show an economic growth slowdown.
Spot gold has nudged up, helped by the weakening of USD.
Growth in the US economy has shown a slowdown since Q4. If Q1 GDP underperforms it will likely push gold prices higher and test resistances. Conversely, if the Q1 GDP reading beats expectations, then it will likely weigh on gold prices and test supports.
The resistance level is at 1268, followed by 1270 and 1273.
The support line is at 1265, followed by 1263 and 1260.