This article was submitted by Antreas Themistokleous, an analyst at Exness.
This preview of weekly data looks at USOIL and XAUUSD where economic data coming up later this week are the main drivers in the markets for the near short term outlook.
This article was submitted by Antreas Themistokleous, an analyst at Exness.
This preview of weekly data looks at USOIL and XAUUSD where economic data coming up later this week are the main drivers in the markets for the near short term outlook.

The most important economic data for this week are:
Thursday:
Friday:
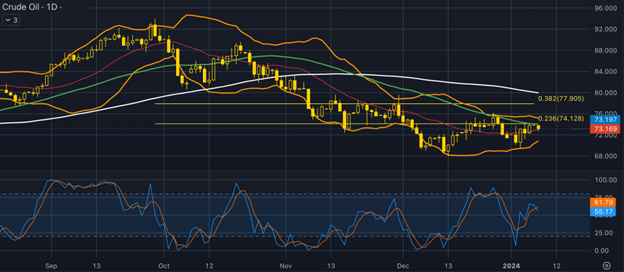
Oil prices fell on Monday due to price cuts by Saudi Arabia and an increase in OPEC output. Saudi Arabia’s decision to cut the February official selling price (OSP) of its flagship Arab Light crude to Asia, along with rising supply and competition with rival producers, contributed to the drop in prices. However, concerns about escalating geopolitical tension in the Middle East provided some support to oil prices. The OPEC output rose by 70,000 barrels per day in December, offsetting the upward pressure on prices. Additionally, the US saw a slight increase in oil drilling rigs reaching 501 rigs last week.
Don’t miss out the latest news, subscribe to LeapRate’s newsletter
On the technical side the price has found sufficient resistance exactly on the 23.6% of the daily Fibonacci retracement level and has been unable to break above it for the last 3 consecutive sessions. The area of $74 is a rather strong technical resistance level since it also consists of the 50-day moving average. The Bollinger bands have contracted indicating that volatility is thin in the crude oil market while at the same time the Stochastic oscillator is not indicating any extreme overbought or oversold levels hinting that the short term direction of the price might head either way.
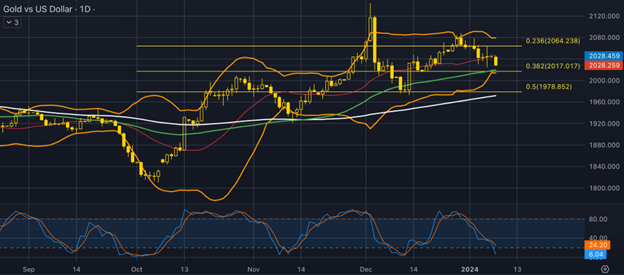
Gold prices are also dropping due to the loosening of aggressive policy from the Federal Reserve. The US’s strong monthly employment report has, in turn, produced a more comforting investor sentiment, leading to a higher US Treasury bond yield and stronger US dollar positioning. Although, the market still predicts interest rate cuts to fall in March of this year, with the hopes that the Fed will introduce multiple cuts throughout 2024. This will positively affect gold prices, as could the upcoming US consumer inflation figures.
From the technical point of view, gold price is currently trading at just above the major support area of $2,017 price level, which combines the 50-day moving average, the 38.2% of the weekly Fibonacci retracement level and the lower section of the Bollinger bands. The 50-day moving average is trading above the 100-day moving average. This indicates that the overall bullish momentum is not yet at arm’s length. Similarly, the Stochastic oscillator is in the extreme oversold levels, suggesting that a potential a correction to the upside might be a necessary and realistic move in the near short term outlook.
DISCLAIMER:
The opinions in this article are personal to the writer and do not reflect those of Exness or Leaprate.