This article was written by Ipek Ozkardeskaya, Senior Market Analyst at FCA regulated broker London Capital Group Holdings plc (LON:LCG).

Ipek Ozkardeskaya, LCG
The Fibonacci sequence is a series of numbers that seem to consistently occur in nature.
0, 1, 1, 2, 3, 5, 8, 13, 21, 34, …
The next number is found by adding up the two numbers before it.
The 2 is found by adding the two numbers before it (1+1).
Similarly, the 3 is found by adding the two numbers before it (1+2).
The 5 is (2+3), and so on.
It appears many times in geometry, art, architecture and other areas.
For those who are interested, there is a broad history and an interesting theory relating to the Fibonacci numbers.
In trading, Fibonacci levels are commonly used in determining technical levels in forex and indices trading, hence it is good to keep an eye on key Fibonacci ratios. In their simplest forms, they are commonly used to help ascertain potential support and resistance levels.
The most commonly used Fibonacci levels are 23.6%, 38.2%, 50.0%, 61.8% and 76.4%.
Among these, the most important ratio is 61.8%, which is sometimes referred to as the ‘Golden Ratio’. When we take any two successive Fibonacci numbers, their ratio is very close to the Golden Ratio, which is approximately 1.618034.
Equally the 38.2% level is considered as an important technical level and is broadly used to distinguish between a price correction and a trend reversal.
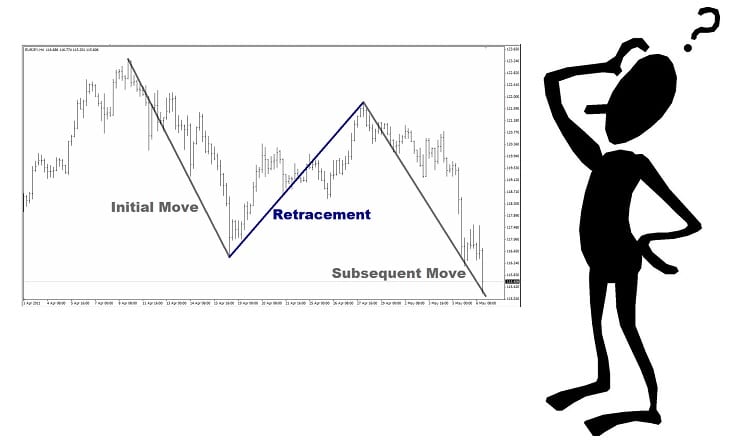
For example, the 38.2% retracement (or equally 61.8% level) on a rally, could be expected to lend an important support to the positive trend. If the 38.2% retracement level holds as strong support, then the pair could be considered in a bullish trend, and this Fibonacci support could be considered as an interesting level to enter a long position. A break of this important technical level could signal a deeper sell off and could be used as a signal to enter a short position.
Do the Fibonacci levels work?
Given that these ratios are widely monitored, it could be expected that there will be significant amounts of orders abound at and about these levels, hence endogenously will have an impact on the price movements. This is often called a self-fulfilling prophecy – which partly explains why the commonly accepted technical levels are important to traders.
Fibonacci levels also form a base for well-rounded and more sophisticated technical studies, such as trading patterns, or Elliott Waves.
How to set Fibonacci retracements on a chart?
It is quite straightforward. The idea is to determine a top or significant high, or the bottom or significant low of a trading cycle and define the levels that could possibly shelter the market offers.
LCG Trader offers a broad charting package, including the Fibonacci retracement, in order to help traders to determine where the market may move next.
Fibonacci is a powerful technical tool for traders, which can help in choosing a direction for a position. It can also help to assign a target level for taking profit.