This article was submitted by Antreas Themistokleous, an analyst at Exness.
This preview of weekly data looks at USOIL and XAUUSD, where economic data coming up later this week are the main drivers in the markets for the near short-term outlook.
This article was submitted by Antreas Themistokleous, an analyst at Exness.
This preview of weekly data looks at USOIL and XAUUSD, where economic data coming up later this week are the main drivers in the markets for the near short-term outlook.

The most important economic data for this week are:
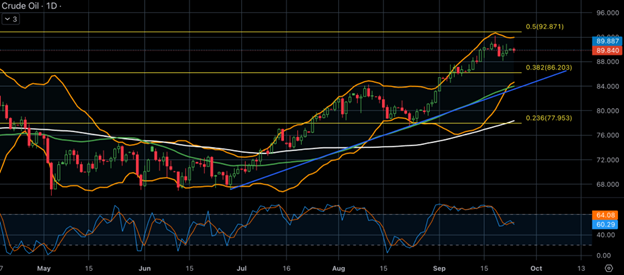
Oil prices rose on Monday as investors were optimistic about a tighter supply outlook following a temporary ban on fuel exports issued by Moscow. The market is still cautious about potential rate hikes by the Fed that could affect demand; however, there was a three-week rally in the price thanks to Saudi Arabia and Russia extending production cuts until the end of the year. Moscow’s temporary ban on gasoline and diesel exports to most countries added to concerns about low product supply, particularly for heating oil during the winter season. In the United States, the number of operating oil rigs decreased to 507, the lowest since February 2022, while expectations of positive economic data from China, the largest crude importer, also boosted sentiment. However, oil prices may face technical resistance at the November 2022 highs at around $93.
On the technical side, the price has found sufficient resistance on the upper band of the Bollinger bands and has since corrected to the downside with some signs of bullish momentum building up in the most recent sessions. The price is trading above all moving averages and the bullish trend line indicates the bullish momentum is still ongoing. In addition, the 50-day moving average is trading above the 100-day moving average, further validating the bullish movement.
In any case, the price area of $93 is the major technical resistance level consisting of 50% of the weekly Fibonacci retracement level as well as the previous high of November 2022. In the event that the price continues on the bearish correction move, then there might be strong support around the $86 area, which consists of the 38.2% of the weekly Fibonacci retracement level, the lower band of the Bollinger bands and is also just above the bullish trend line.
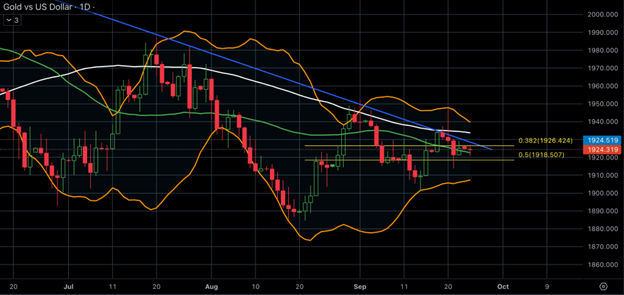
Gold prices remained stable on Monday as investors analyzed the U.S. Federal Reserve’s decision to signal potential future interest rate hikes. The lack of demand for gold is evident in the falling holdings of global gold exchange-traded funds, while higher interest rates and yields are putting pressure on the precious metal. The dollar is at a six-month high, and 10-year Treasury yields are near a 16-year peak. Investors are also awaiting the personal consumption expenditures price index on Friday and monitoring the spending bill negotiations in Washington, which could result in a government shutdown if there is no decision made until September 30th.
Don’t miss out the latest news, subscribe to LeapRate’s newsletter
From the technical point of view, gold prices have corrected to the downside in recent sessions after finding sufficient resistance on the 100-day moving average and the bearish trend line. The faster-moving average (50 days) is trading below the slower one (100 days), indicating that the overall bearish momentum is still valid while currently, the price is testing the resistance of the 38.2% of the weekly Fibonacci retracement and the support of the 50-day moving average.
U.S. data coming up on Thursday and Friday are expected to create volatility on the majority of the dollar pairs, so any trading initiated on gold this week needs to take into account money management rules and risk assessment before opening the trades.
DISCLAIMER:
The opinions in this article are personal to the writer and do not reflect those of Exness or LeapRate.