This article was submitted by Antreas Themistokleous, an analyst at Exness.
This preview of weekly data looks at EURUSD and XAUUSD where economic data coming up later this week are the main drivers in the markets for the near short-term outlook.
This article was submitted by Antreas Themistokleous, an analyst at Exness.
This preview of weekly data looks at EURUSD and XAUUSD where economic data coming up later this week are the main drivers in the markets for the near short-term outlook.

The most important economic data for this week are:
Tuesday:
Wednesday:
Thursday:
Friday:
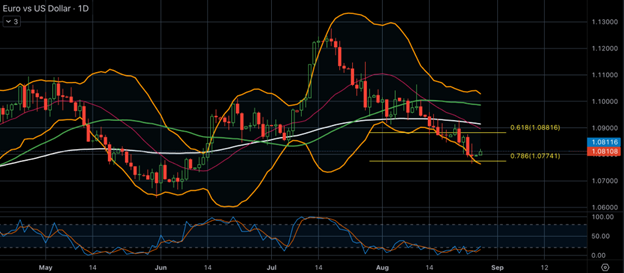
The U.S. dollar remains vulnerable as speculators’ net short positions decrease , as is reflected on the recent sessions on the daily chart, but are still significant enough to potentially trigger a short squeeze. The USD index has found resistance at a key technical level of the reaction area around $1.04300 where the price found resistance in early June and is probably near a correction to the downside. The Federal Reserve Chair Jerome Powell’s recent speech supported the dollar on the 24th and 25th and has hinted at possible interest rate hikes boosting the probabilities of such a hike for the November meeting of the FED according to the Fedwatch Tool of CME.
On the technical side the price has found sufficient support just above the weekly 78.6% of the weekly Fibonacci retracement level as well as the lower band of the Bollinger bands and is currently correcting to the upside. Usually but not always a move away after consecutive touches on the Bollinger bands means that a correction might be imminent. If this is confirmed and we do see a correction to the upside then the first area of possible technical resistance could be around the $1.090 which consists of the 61.8% of the weekly Fibonacci retracement level, the area of the 20 and 50 day moving averages as well as the psychological resistance of the round number.
The bullish narrative is also supported by the extreme oversold level on the Stochastic oscillator which is in effect for the last month as well as the fact that the faster moving average (50 days) is trading above the slower one (100 days) indicating that the overall bullish momentum is still in effect and a correction to the upside is quite possible.
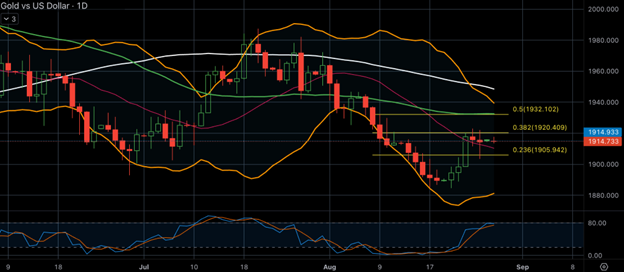
Gold held steady on Monday as investors processed hawkish comments from Federal Reserve Chair Jerome Powell. The comments came ahead of a week filled with U.S. economic data that is expected to provide insights into inflation and the labor market. Despite the steady performance, the higher dollar and a decrease in 10-year Treasury yields limited gold’s gains. The upcoming economic data, including the U.S. core PCE inflation and August non-farm payroll report, will likely provide more clarity on the strength of the economy and most likely spark volatility in the instruments traded against the greenback.
From the technical point of view gold prices have corrected to the upside after finding sufficient support on the lower band of the Bollinger bands and is now trading in the area between the 23.6% and the 38.2% of the daily Fibonacci retracement level. The combination of the Stochastic oscillator being near the extreme overbought level and the 50 day moving average trading below the 100 day moving average is a strong indication that the price might be about to resume the previous bearish trend. If this happens then we might see the first point of support around the $1.906 and the second level of support around $1,900 being reached. The first area of support is the 23.6% of the daily Fibonacci retracement while the second area of support is the psychological support of the round number and is also an area on the chart that the price failed to make a valid break below since mid March.
If you want to learn more about what is moving the markets, join our monthly live analysis
and trading session on September 11th. Register here.
DISCLAIMER
The opinions in this article are personal to the writer and do not reflect those of Exness or LeapRate.