This article was submitted by Aaron Hill from FP Markets.
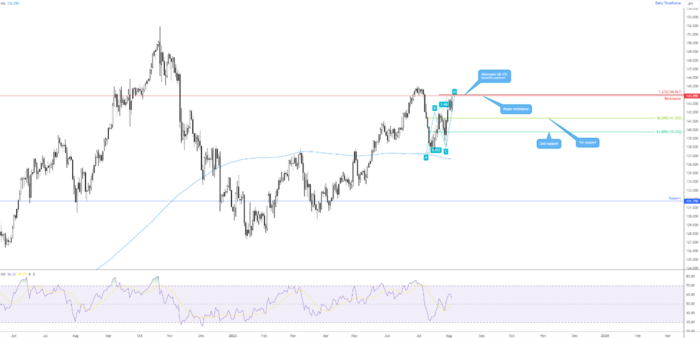
The USD/JPY recently touched gloves with a major long-term resistance at ¥143.89 and is on track to pencil in a bearish outside reversal candle on the daily timeframe. Adding to this, price action came within striking distance of connecting with a daily ‘alternate’ AB=CD bearish formation at ¥144.03 (denoted by a 1.272% Fibonacci projection) before rotating lower.
Absent any obvious support on the daily chart, technicians are likely to target the 38.2% and 61.8% Fibonacci retracement ratios derived from legs A-D at ¥141.33 and ¥139.74, respectively.
Daily Chart:
TradingView
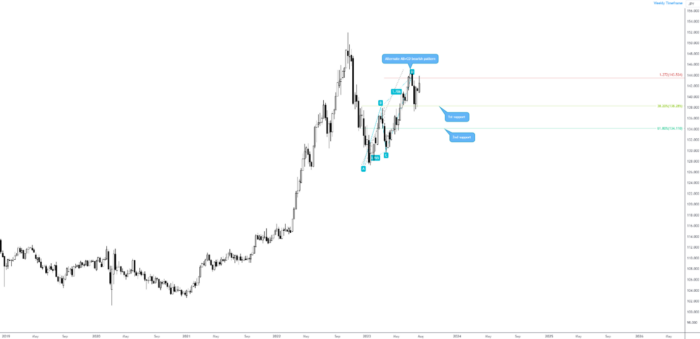
Weekly Alternate AB=CD Bearish Pattern Also in Play
Interestingly, on the weekly timeframe, we can see that price action has also been working with an ‘alternate’ AB=CD bearish formation at ¥143.53. But and this is key, we can also see that the currency pair has tested the ‘1st support’ target at ¥138.29: the 38.2% Fibonacci retracement ratio derived from legs A-D. As a result, with the 1st downside support achieved and buyers making a show, further upside may eventually materialise.
However, given that we are seeing weekly price test ¥143.53 again at a time the daily chart is shaking hands with an AB=CD bearish pattern, this could be enough to pull price action lower towards at least the 38.2% Fibonacci retracement ratio on the daily timeframe at ¥141.33.
Weekly Chart:
TradingView
Disclaimer:
The information contained in this material is intended for general advice only. It does not take into account your investment objectives, financial situation or particular needs. FP Markets has made every effort to ensure the accuracy of the information as at the date of publication. FP Markets does not give any warranty or representation as to the material. Examples included in this material are for illustrative purposes only. To the extent permitted by law, FP Markets and its employees shall not be liable for any loss or damage arising in any way (including by way of negligence) from or in connection with any information provided in or omitted from this material. Features of the FP Markets products including applicable fees and charges are outlined in the Product Disclosure Statements available from FP Markets website, www.fpmarkets.com and should be considered before deciding to deal in those products. Derivatives can be risky; losses can exceed your initial payment. FP Markets recommends that you seek independent advice. First Prudential Markets Pty Ltd trading as FP Markets ABN 16 112 600 281, Australian Financial Services License Number 286354.
Opinions are personal to the authors and do not reflect the opinions of LeapRate. This is not a trading advice.
Having gained a degree in economics, Alan entered the world of financial services starting his career in London and then moving to New York for a number of years. His first post at a City bank saw him establish a reputation as an forex trader. Having recently returned from New York after eight successful years, Alan is now a prosperous trader in his own right concentrating on commodities and forex.