This article was submitted by Michael Stark, market analyst at Exness.
Markets have been a bit calmer at this week’s open, with various Asian shares posting modest losses. Gold meanwhile has continued to appreciate, moving closer to its six-year high slightly above $1,700.
This week’s key event among central banks is the meeting of the Bank of Canada on Wednesday afternoon. The BoC is expected to cut rates again to 0.25%. Last week’s meetings were fairly uneventful: the National Bank of Poland cut its reference rate to half a percent as expected, but the Bank of Israel’s cut to 0.1% was slightly bigger than the consensus.
The focus this week is likely to remain on gold, oil and the dollar, but many traders will also note the range of Chinese data. The most important of these releases is Friday’s annual GDP growth for Q1, expected at negative 6%.
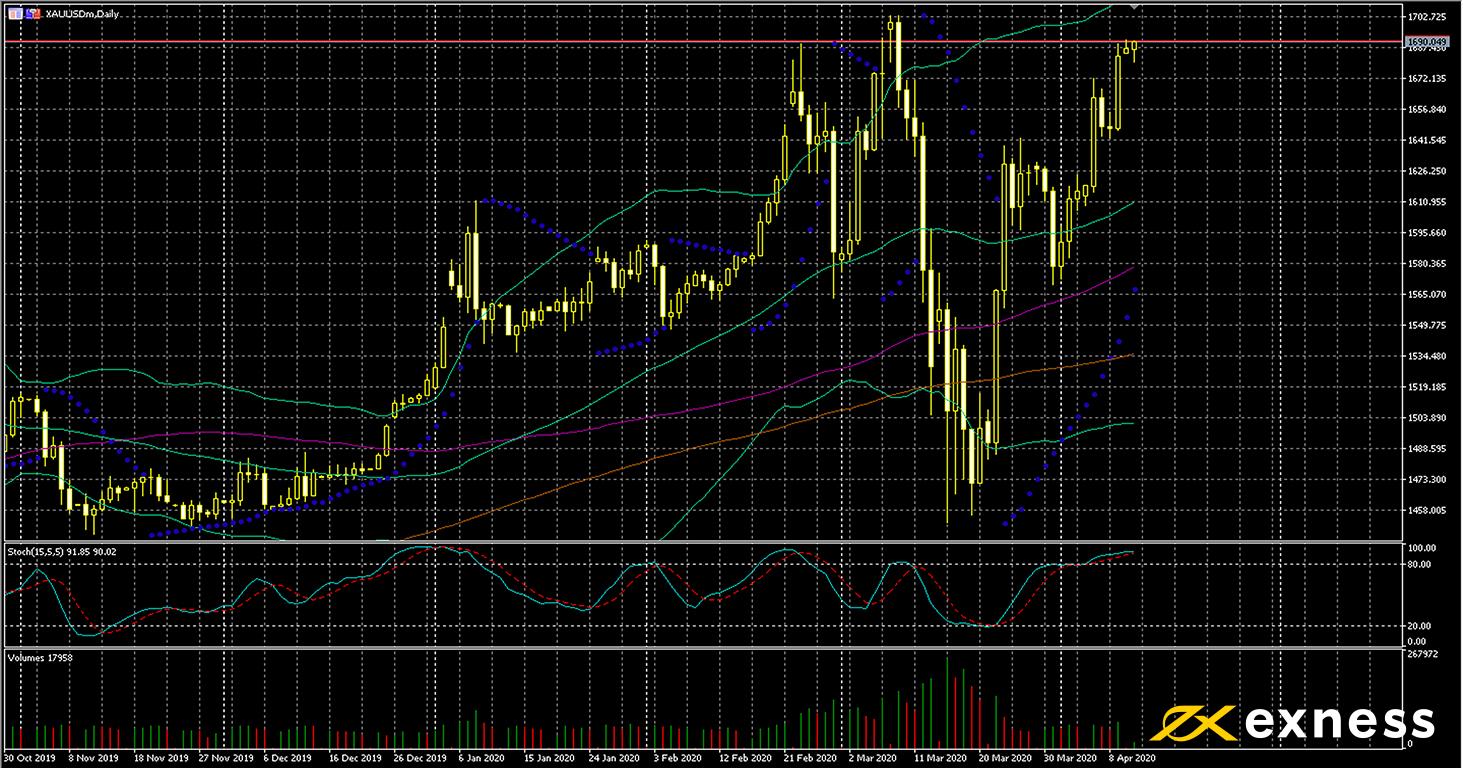
Gold-dollar, four-hour
Gold has rallied against most currencies very strongly since the initial wave of panic selling. Now that interest rates in most major developed countries are at zero or nearly zero, the yellow metal has started to shine for investors.
With liquidity improving and lockdowns easing in some countries, it’s also easier for these investors in the physical metal to go out and purchase it. While many shares have recovered to a degree last week, there’s still a very low likelihood of a ‘v-shaped’ recession, and most analysts seem to expect a worst-case scenario for the economy in the rest of the year.
Price has remained above all of the 50, 100 and 200 SMAs since nearly the beginning of April and buying volume has generally remained high. The big challenge for buyers is the crucial psychological area of $1,700. The slow stochastic at 91 though reads strongly overbought.
There probably won’t be much direct impact from data this week given that very negative releases are mostly priced in. Most traders might focus instead on stock markets and news of the virus in the USA.
Wednesday 15 April, 12.30 GMT: American monthly retail sales (March) – consensus -7%, previous -0.5%
Thursday 16 April, 12.30 GMT: American initial jobless claims (11 Apr) – consensus 4.7 million, previous 6.6 million
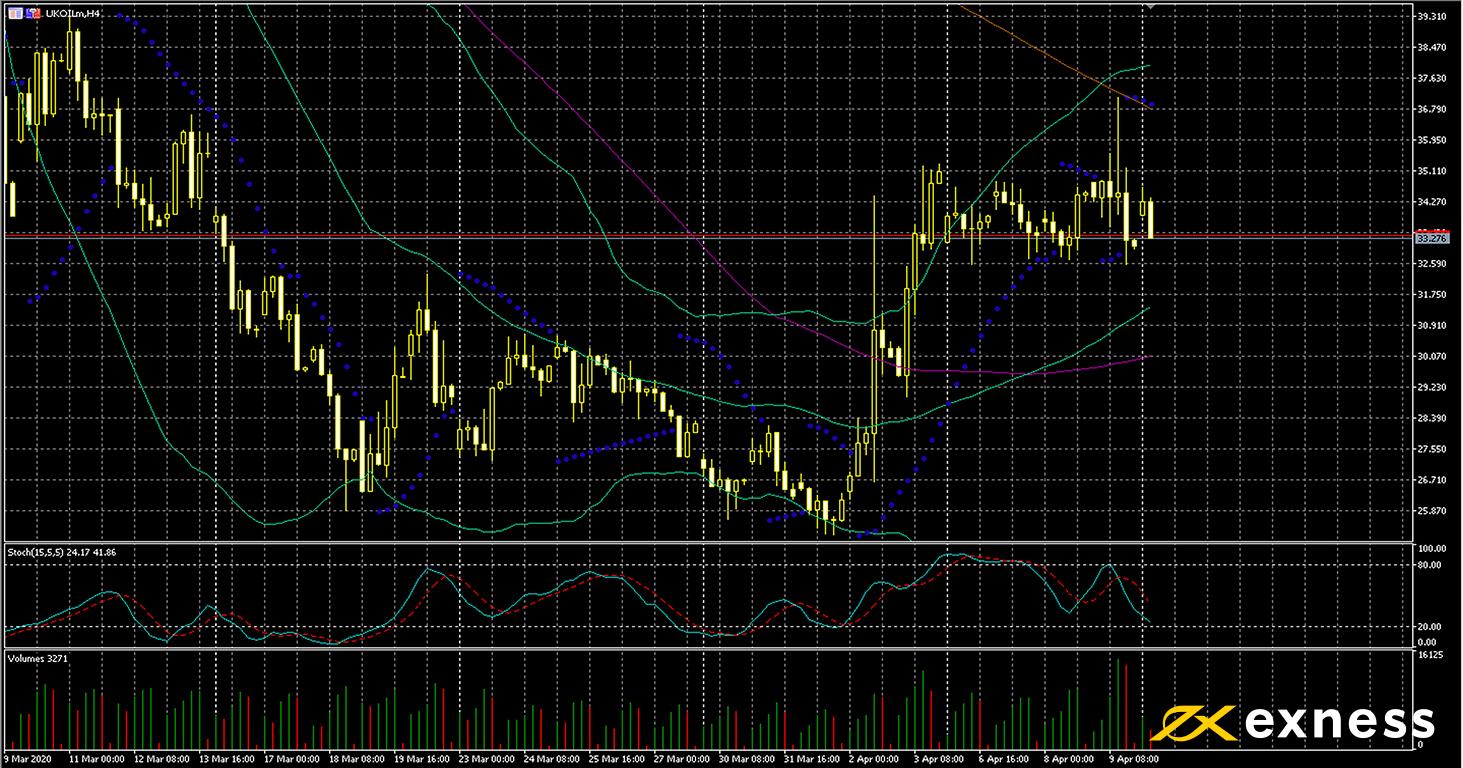
Brent, four-hour
There hasn’t been any ongoing direction for crude oil in the aftermath of OPEC+’s meeting and agreement to cut production. Global production of oil is to be cut by around 10% or 10 million barrels daily according to the agreement among the cartel and its allies.
Various energy ministers within OPEC have also noted that they expect other major producers of oil to cut as well. These include the USA most importantly, but also Canada, Norway and Mexico. Very low demand is likely to remain a problem for crude throughout 2020.
Price is within the value area between the 100 and 200 SMA, although it’d be fair to say that this particular value area is much larger than what would’ve been usual for most of 2019. The spike around Thursday’s initial agreement doesn’t necessarily suggest more gains given the current fundamental situation.
Comparison with the daily charts shows us that the downtrend is still active, so many traders might look to enter near the top of the current range. A breakout in either direction could occur though if non-OPEC+ countries start to confirm cuts to production. This week’s regular stock data from the USA is also very important.
Key data points
Bold indicates the most important release for this symbol.
Tuesday 14 April, 20.30 GMT: API crude oil stock change (10 Apr) – previous 11.94/million
Wednesday 15 April, 8.00 GMT: IEA’s oil market report
Wednesday 15 April, 14.30 GMT: EIA crude oil stock change (10 Apr) – previous 15.18 million
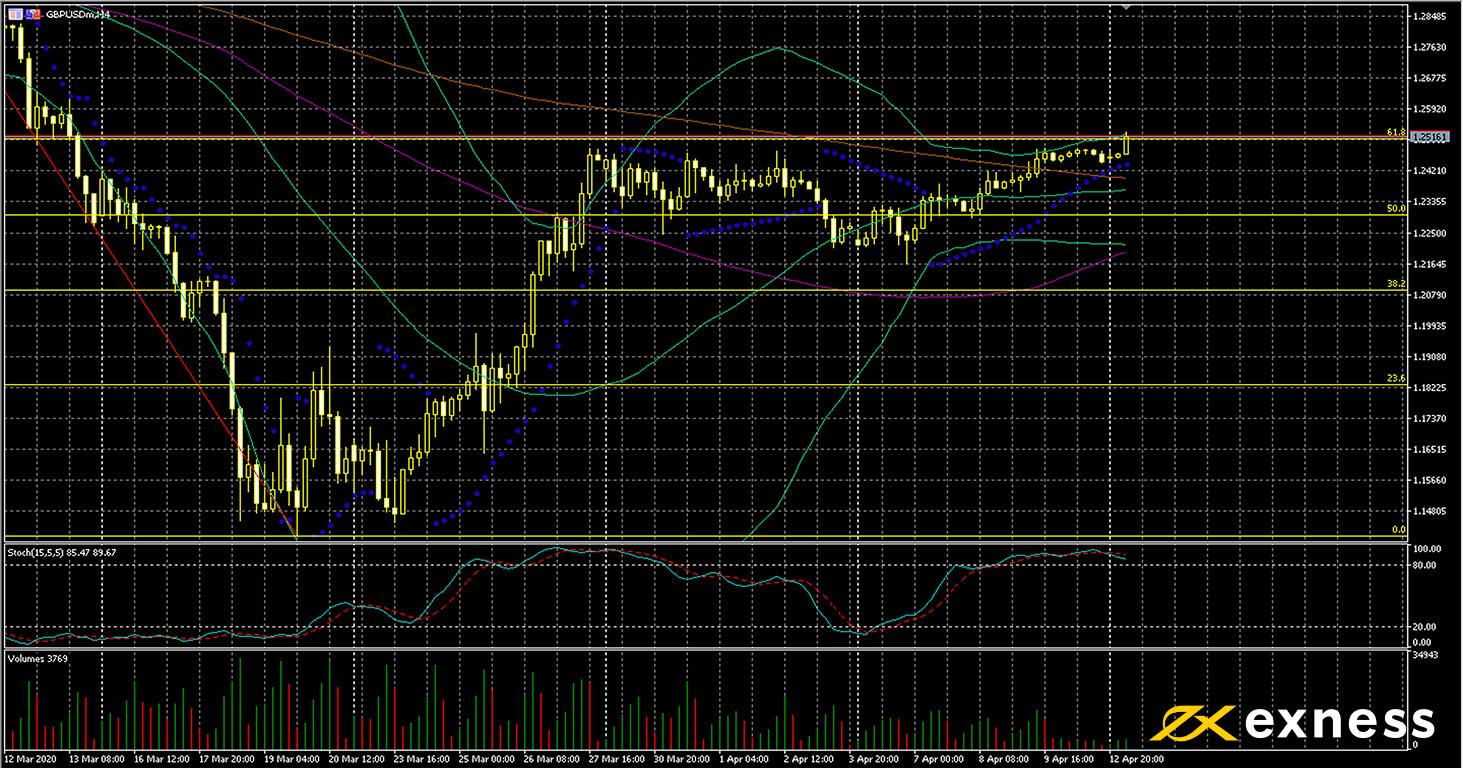
Cable, four-hour
The pound has traded somewhat higher against various currencies recently. Boris Johnson seems to have recovered from the coronavirus somewhat and the Bank of England is essentially making as much money as needed to finance relief efforts for the NHS and the economy. The situation still seems to be significantly worse in the USA.
Price is currently testing the 61.8% Fibonacci retracement area based on the daily charts. Moving averages give a buy signal at the time of writing, with a successful breakthrough of the 200 SMA last week. The main concern for buyers is overbought readings from Bands and the slow stochastic combined with very low volume. There isn’t any significant data due from the UK this week, so politics and the virus are likely to be the main factors watched.
Key data points
Wednesday 15 April, 12.30 GMT: American monthly retail sales (March) – consensus -7%, previous -0.5%
Thursday 16 April, 8.30 GMT: BoE’s survey on credit conditions
Thursday 16 April, 12.30 GMT: American initial jobless claims (11 Apr) – consensus 4.7 million, previous 6.6 million
Disclaimer: opinions are personal to the author and do not reflect the opinions of Exness or LeapRate.