This weekly data preview focuses on USOIL and XAUUSD, with upcoming economic data later in the week serving as the main market influencers for the short-term outlook.
Weekly Data: Oil and Gold: Brief Review before the Fed

Below, we look at the key factors impacting economic data this week.
Wednesday:
- UK inflation rate at 7:00am GMT. The consensus is for a decline from 4% to 3.5% in February. If these forecasts hold true, it could mark the lowest yearly inflation figure for Britain and might lead to slight losses for the pound, potentially influencing the Bank of England’s decisions at its meeting the following day.
- FED interest rate decision at 6:00pm GMT is broadly expected to stay steady at 5.5%, with the probability of less than a 1% cut. Participants are focusing closely on what the comments of the central bankers in the subsequent press conference will be to get some hints as to the future direction of monetary policy.
- Japanese balance of trade at 11:50pm GMT, where the expectations are for a decline in the trade deficit from ¥-1,758.3bn to ¥-810.2bn for February. If the expectations are correct, then the yen could face some support against the currencies traded against it.
Thursday:
- The Bank of England decides on its interest rate at 12:00pm GMT. The general expectation is that the central bank will hold its rate stable at 5.25%. However, in the event that there is an interest rate hike, it could give some support to the pound across various pairs, particularly the US dollar. In the unlikely event of a cut though, it might have a negative effect on the British pound in the aftermath of the release.
- Japanese inflation rate at 11:30pm GMT. The expectation for February is that the rate could go up to 3% from the previous 2.2%. This might be somewhat bullish news to the market participants trading the yen.
USOIL, daily
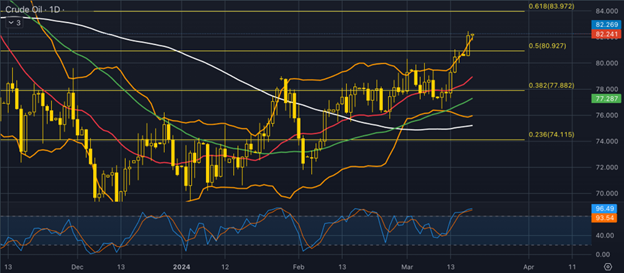
Oil prices reached a four-month high due to lower crude exports from Iraq and Saudi Arabia, as well as signs of stronger demand and economic growth in China and the US. Iraq plans to reduce crude exports in the coming months to adhere to its OPEC+ quota, while Saudi Arabia’s crude exports decreased for the second consecutive month.
Stronger-than-expected economic growth in the US and robust demand for crude oil in China are contributing to the upward pressure on oil prices.
Don’t miss out the latest news, subscribe to LeapRate’s newsletter
On the technical side, the price is trading in a rather aggressive bullish trend and is currently testing the resistance of the upper band of the Bollinger bands. The 50-day moving average is trading well above the 100-day moving average, validating the bullish momentum in the market. However, the stochastic oscillator is trading in the extreme overbought levels, hinting that a correction to the downside might be imminent. However, the aggressive rally does not give much confidence to the bears. Without any significant signals of a reversal, the dominant scenario is for a continuation of the current move north. If this is confirmed in the upcoming sessions, then the first area of possible resistance might emerge near the $84 price region, which is the psychological resistance of the round number as well as the 61.8% of the weekly Fibonacci retracement level.
Gold-dollar, daily
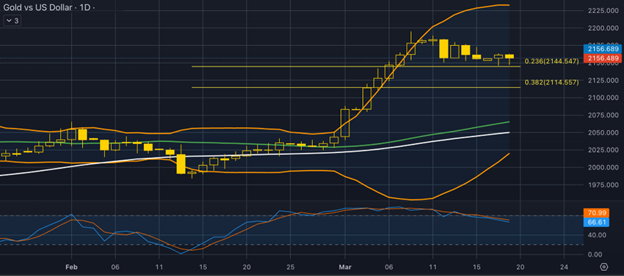
As the FOMC meeting approaches, the price of gold is facing difficulties in attracting buyers and remains steady above a one-week low. Factors such as reduced expectations of a Fed rate cut, higher US bond yields, and a stronger USD (mainly due to the inflation data released last week that showed an uptick in the actual figure) are causing the gold price to perform lower.
Geopolitical tensions may offer some support to gold and could also limit its losses. Also, if we review the Commitment of Traders report, we can see a decline in the number of commercial traders, suggesting that the price of gold might fall. Commercial traders’ figures are inversely related to the price. This is because commercial traders like to buy at lower prices, leading to decreasing figures when prices are high. As a result, prices are pushed down in the short term.
From a technical point of view, the price has corrected from its all-time high of around $2,195 down to $2,155 where it currently trades. In yesterday’s session, the price found sufficient resistance on the 23.6% of the daily Fibonacci retracement level and is currently on the move to cover the bullish candlestick to continue its correction move to the downside. The stochastic oscillator is near its overbought levels, though it’s on the move to reach the neutral levels given that the bearish move continues in the short term. The Bollinger bands are still quite expanded, indicating that volatility is still high in the gold market, while economic data coming up later this week is broadly expected to create even more volatility, especially for the instruments traded against the dollar.
This article was submitted by Antreas Themistokleous, an analyst at Exness.
Disclaimer: The opinions in this article are personal to the writer and do not reflect those of Exness or LeapRate.