This article was submitted by Antreas Themistokleous, market analyst at Exness.
This preview of weekly data looks at GBPUSD and XAUUSD, where economic data coming up later this week are the main drivers in the markets for the near short term outlook.
The most important economic data for this week is:
Tuesday:
1. Canadian inflation rate at 12:30 PM GMT where the market consensus is for a rather optimistic decline of around 0.9% reaching a yearly low of 3.4% for the month of May. Even though this data might have been already priced in, if this figure is accurate it might influence a more dovish stance by the Bank of Canada at their next meeting.
Wednesday:
2. Fed Chair Powell speech where market participants would be paying close attention to get hints on the action plan of the Fed in their next meetings. Hawkish comments could influence gains for the dollar while a more dovish stance could create some short term losses.
Thursday:
3. Preliminary German inflation rate at 12:00 PM GMT. The market is expecting some minor increase on the figure reaching 6.3% in the biggest economy of the European Union.
Friday:
4. European Unemployment rate for the month of May is not expected to change while the flash inflation rate for June is expected to decline to 5.6% against the previous recording of 6.1%. This could have an impact on the next ECB interest rate decision since inflation in Europe is starting to show signs of slowing down.
5. US PCE is not expected to change while personal income and personal spending are expected to decline to 0.3% and 0.2% respectively for the month of May.
Not a very busy week in terms of economic data but Friday is the day with the most major publications this week. Investors and traders will also be closely monitoring the speeches of the Fed and ECB throughout the week to get insights on the future developments on monetary policies in the USA and EU.
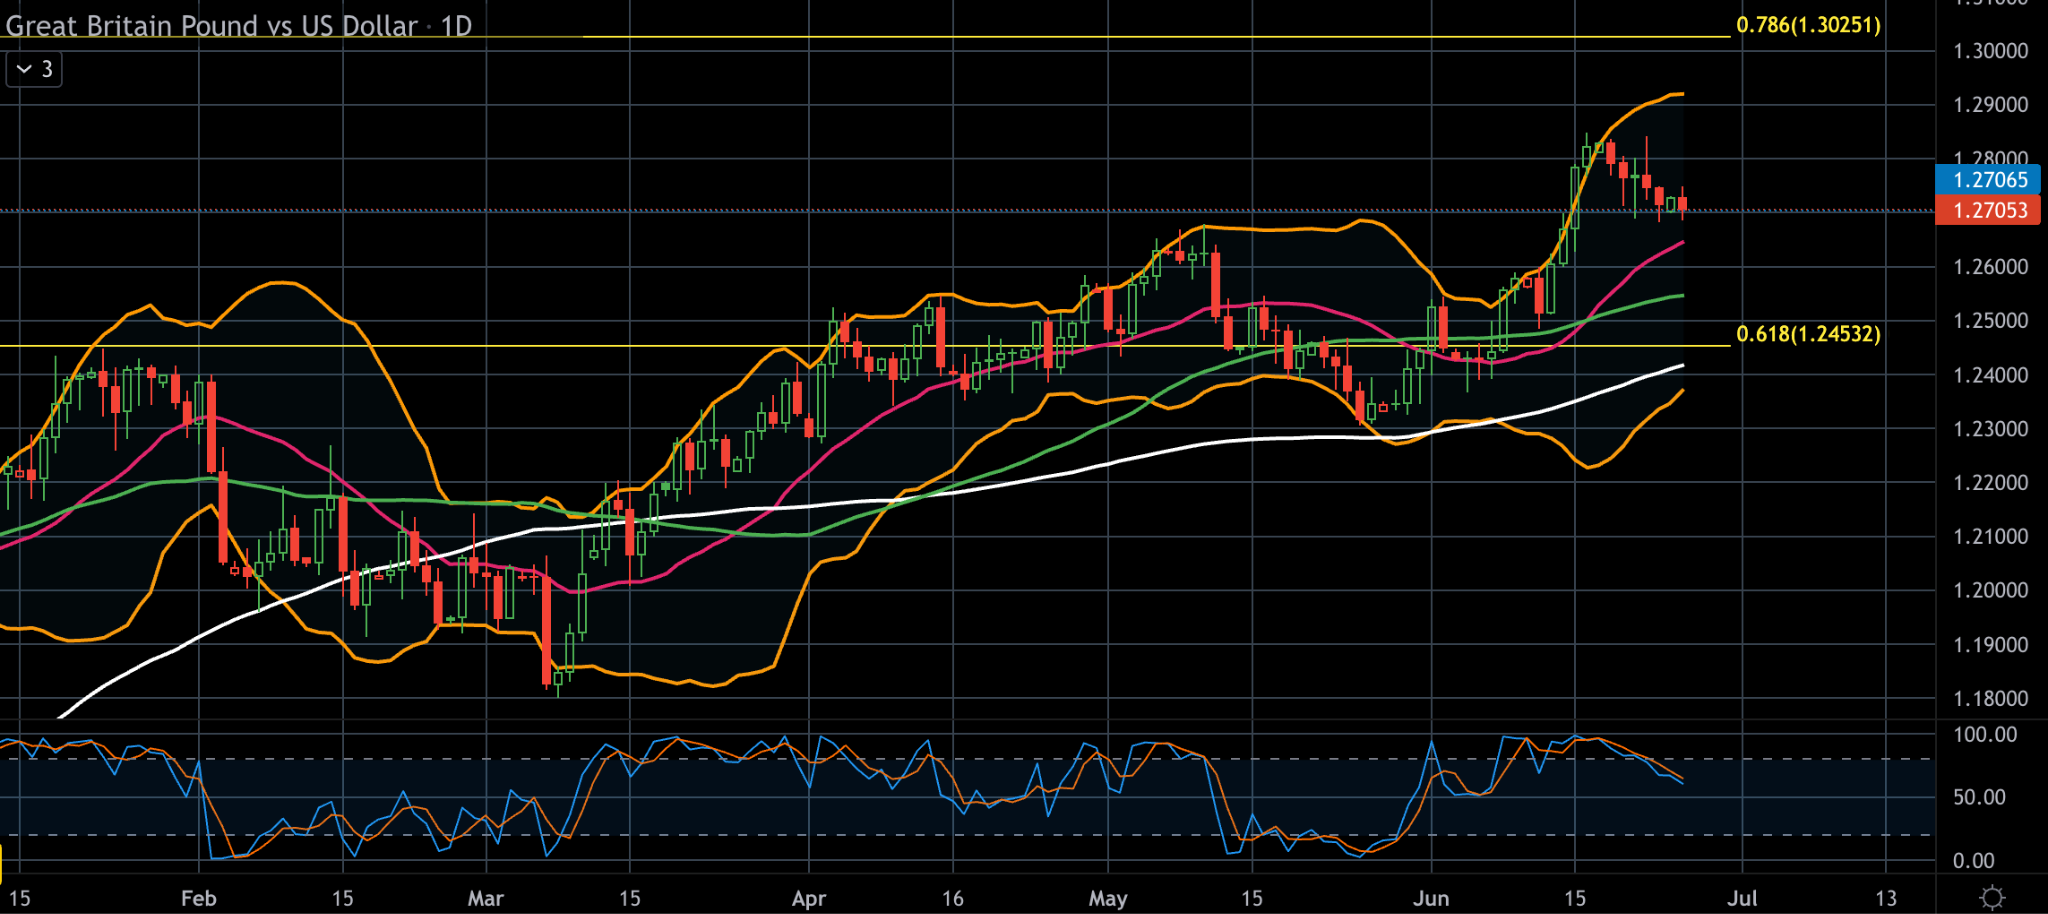
The negative Claimant change on the 13th as well as the decline in unemployment figures in the United Kingdom had a positive effect on the quid against the dollar while the pausing of the Fed on the 14th had also contributed to the gains seen on the daily chart of the cable pair. In regards to last weeks’ economic data, the single hike in interest rates by the Bank of England and the stable inflation rates were not enough to support the British pound and we witnessed short term losses that carry over until the day of this report.
For this week the speech of the chairman of the Fed J.Powell on the 28th and 29th is what draws the attention of market participants in an effort to get hints on the central bankers intentions in regards to the monetary policy and the future of the greenback. Investors and traders will also be monitoring the data on Friday the 30th of June about core PCE as well as personal income and personal spending which is what the Fed is greatly taking into consideration to form their action plan about interest rates decisions.
On the technical side, the price on the chart is currently in a correction status after reaching a yearly high of around $1.28500. The upper band of the Bollinger bands proved to be a strong resistance while the Stochastic oscillator returned back to the “neutral” level after correcting from the “overbought” area. Even though these “negative” indications can be seen on the daily chart, the price is still trading above all of the 20, 50 & 100 day moving averages. The faster moving averages are also trading above the slower one which is a “confirmation” that the overall bullish momentum is still valid regardless of the recent correction to the downside.
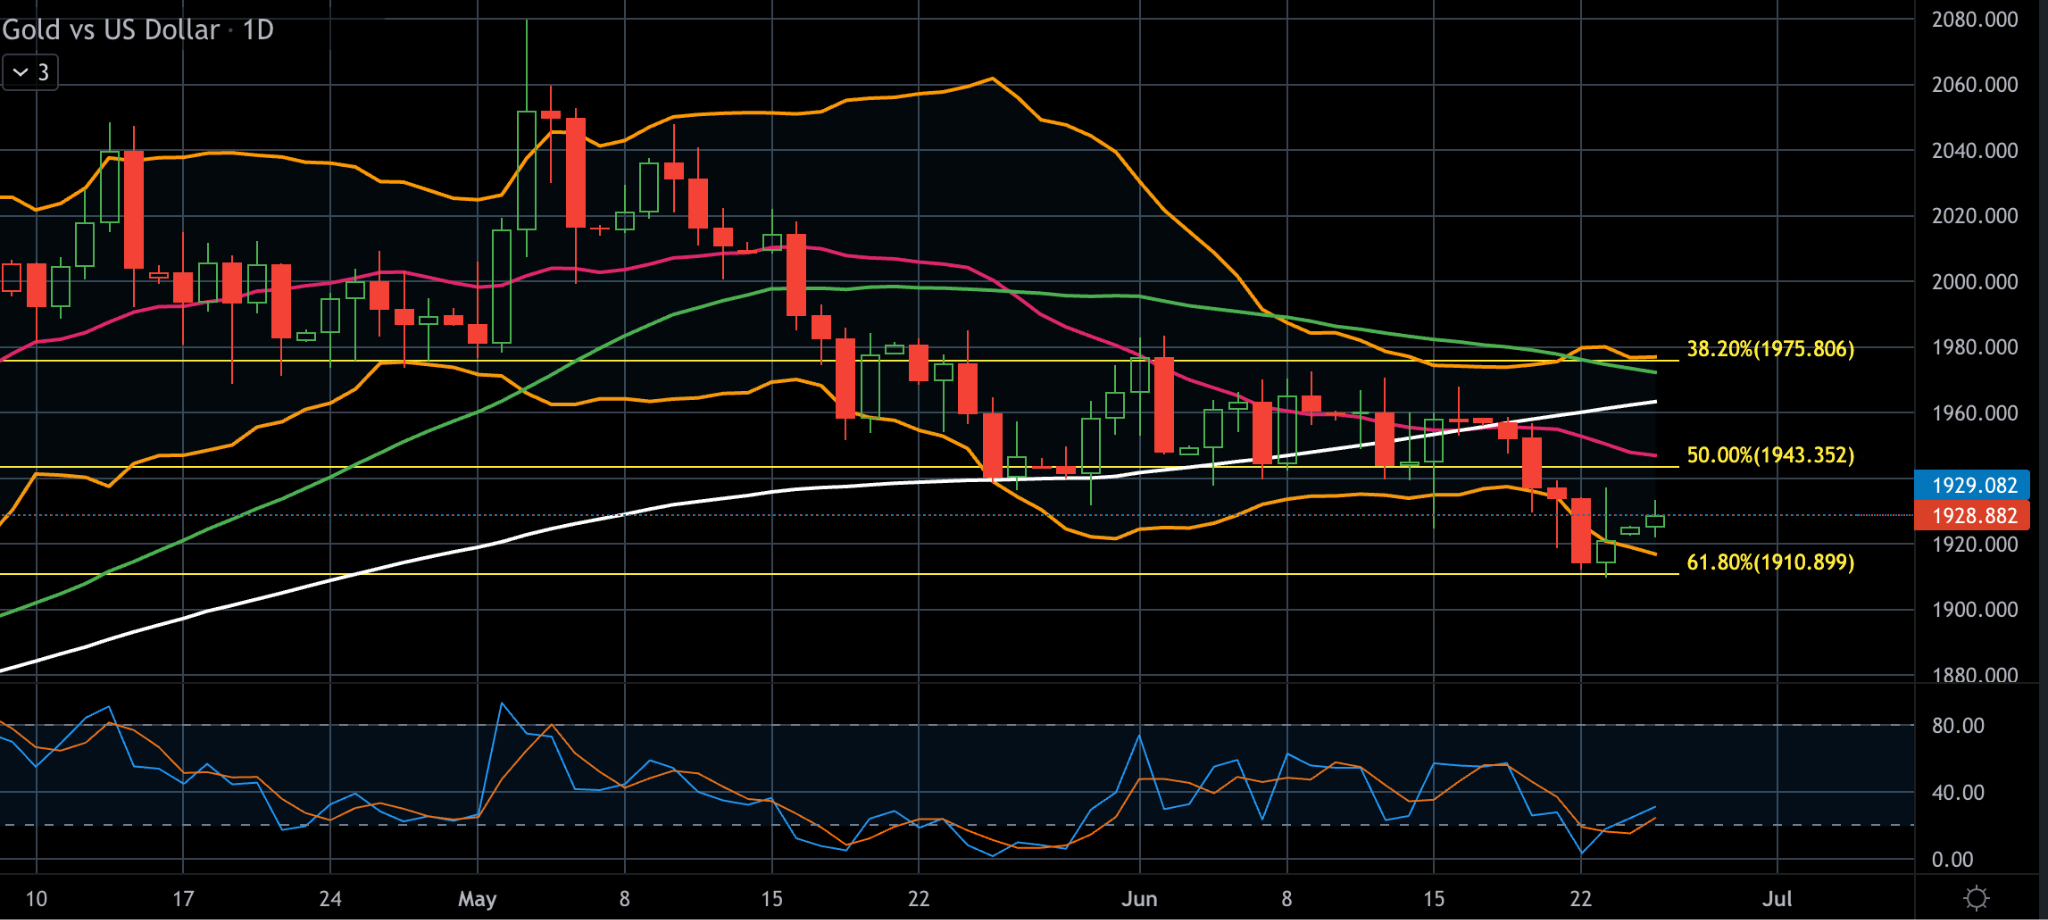
XAUUSD, daily
Gold prices rose on Monday as geopolitical concerns over Russia outweighed pressure from a hawkish interest rate outlook. The yellow metal had dropped nearly 2% the previous week due to hawkish comments from Federal Reserve officials indicating more rate hikes to tame sticky inflation. However, markets saw a 72% chance of a rate hike in July according to Fedwatch tool, with cuts expected to be seen early in 2024 at the Fed’s meeting on the 31st of January. The dollar index edged 0.2% lower, making gold cheaper for holders of other currencies, while competing safe-haven asset Treasury yields hit their lowest since June 7.
From a technical standpoint, the price has been in an overall bearish movement since early May with the steep decline “losing” some momentum in the beginning of June where the price entered a slightly declining channel rather than a full bearish pullback. The level of 61.8% of the weekly Fibonacci retracement level has been a quite strong support area on the chart and the price has been correcting to the upside in the last 3 sessions. The Stochastic oscillator has pulled back from its oversold levels indicating that the minor move up has still potential to continue while the 50 day moving average is still trading above the 100 day moving average possibly signaling that there is some room for the price to continue moving North at least in the short term.
Disclaimer: opinions are personal to the author and do not reflect the opinions of Exness or LeapRate.
Experienced writer and journalist, working in the global online trading sector, Steffy is the Editor of LeapRate. She has previous experience as a copywriter and has been with the company since January 2020. Steffy has a British and American Studies degree from St. Kliment Ochridski University in Sofia.