Technical Market Outlook and Review: On the back of a buoyant dollar, downside risks for the EUR/USD remain high

This article was submitted by Aaron Hill from FP Markets.


EUR/USD

It was a poor start to the week for the common currency, down 0.7% at the close of European trading on Monday. On the back of a buoyant dollar, and a technical bearish landscape, downside risks for the EUR/USD remain elevated.

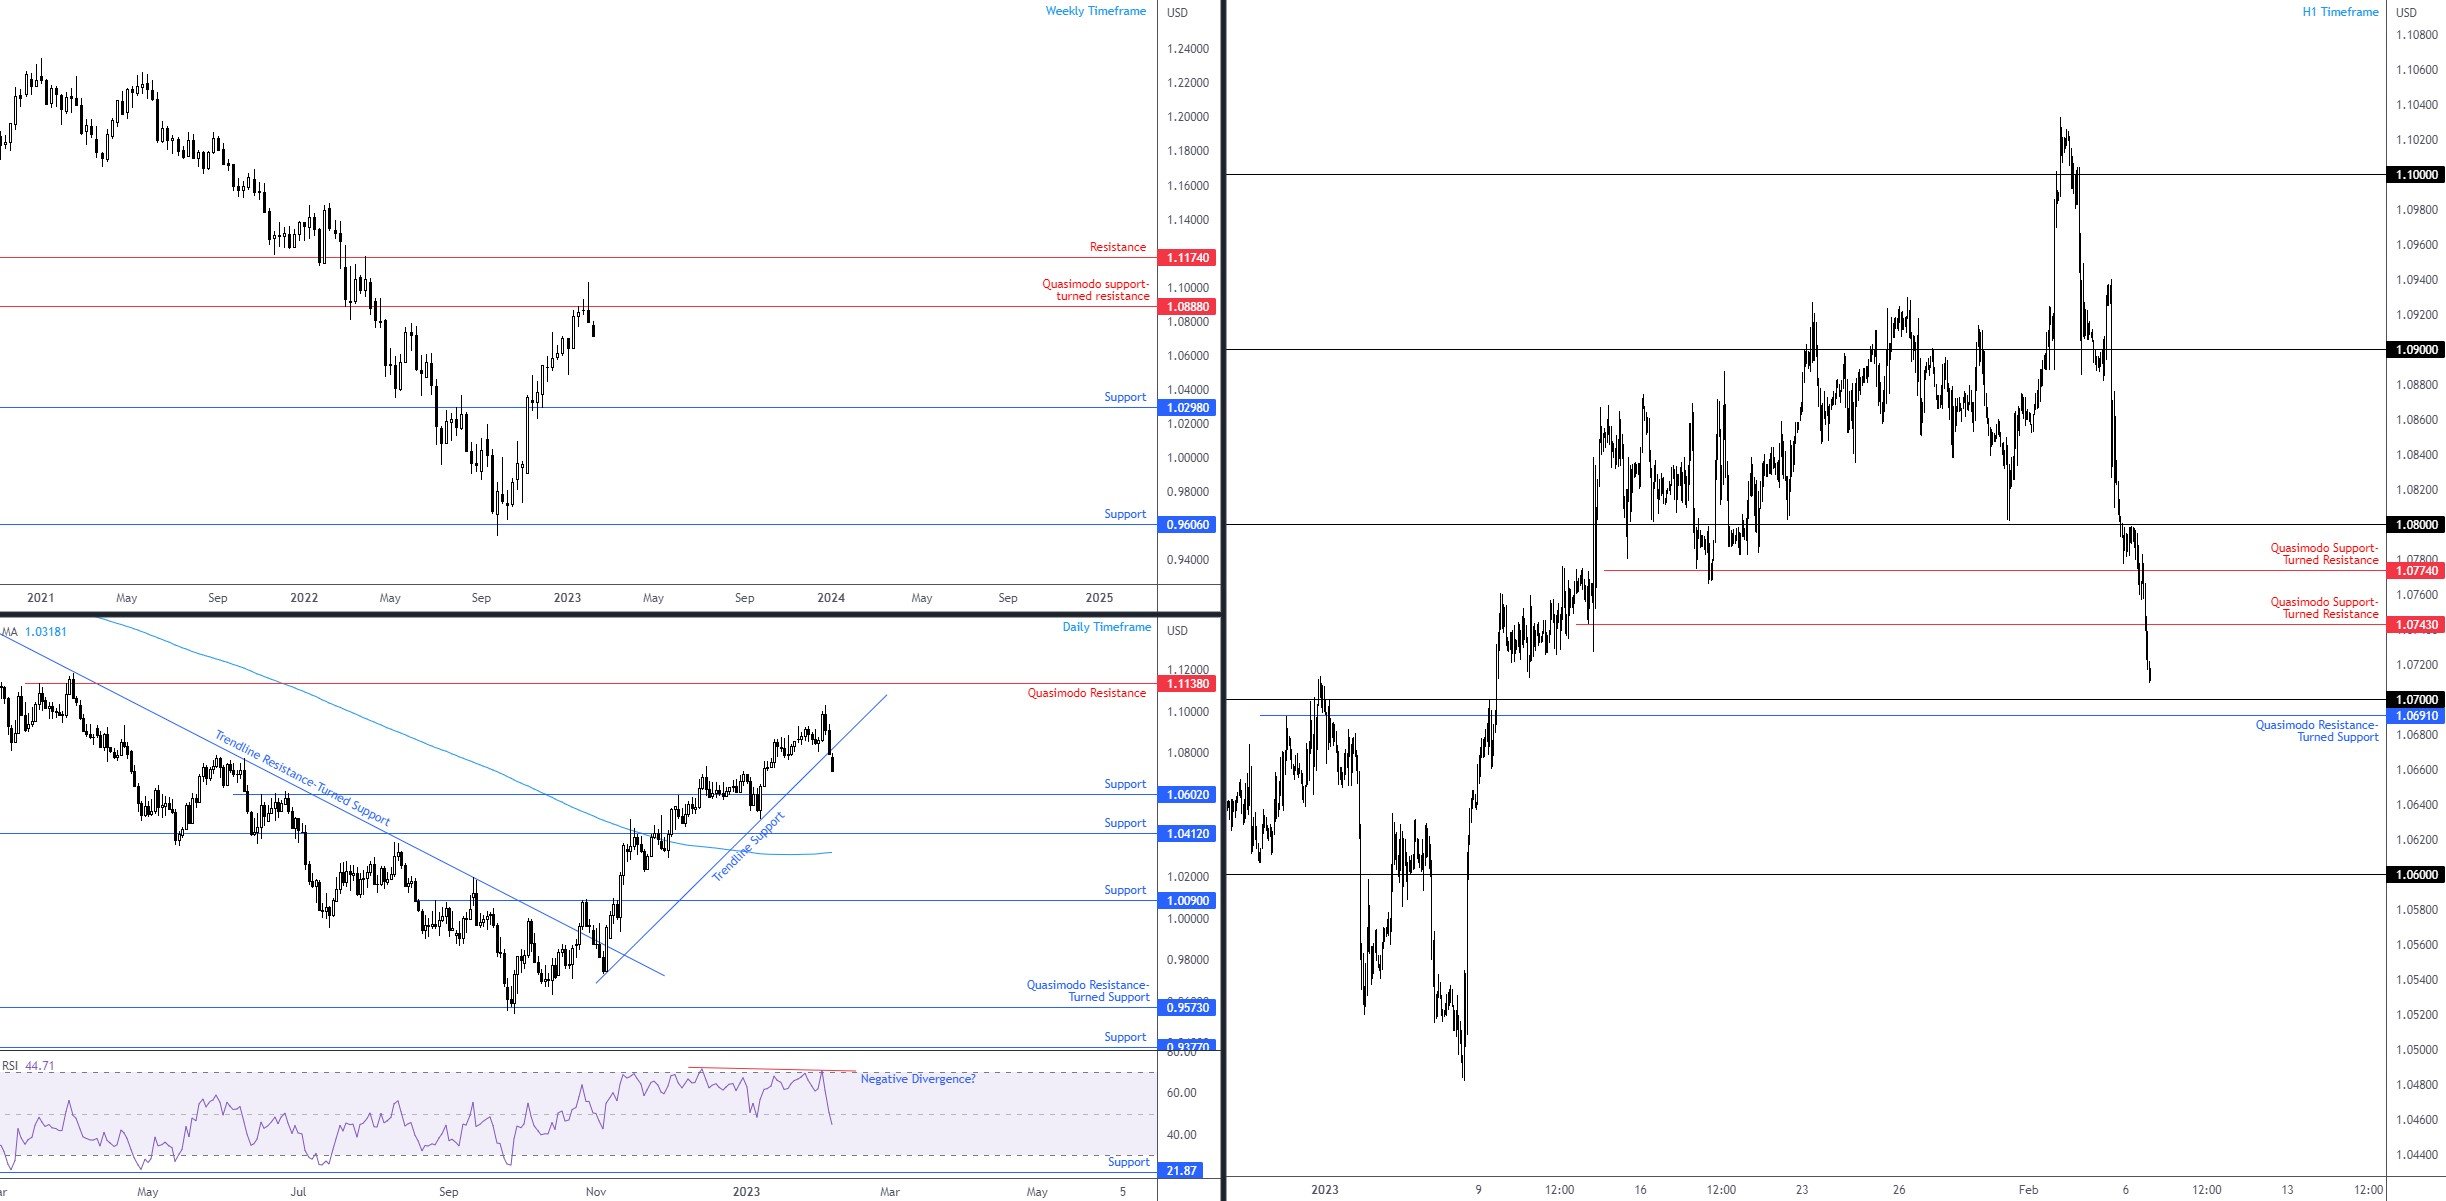
The weekly timeframe recently joined hands with Quasimodo support-turned resistance at $1.0888 and chalked up what is referred to as a shooting star. This bearish combination, together with the prospect of investors welcoming a sell-on-rally scenario based on the pullback from the late September lows at $0.9536, proposes a robust technical headwind for buyers to compete with. Adding to the weekly chart’s bearish representation, price action on the daily timeframe voyaged through trendline support, extended from the low $0.9730. Rupturing the aforementioned line, and the daily chart’s Relative Strength Index (RSI) elbowing through its 50.00 centreline (negative momentum), unmasks daily support coming in at $1.0602. As a note, while the daily timeframe has emphasised an uptrend (series of higher highs/lows since $0.9536), current price forging a lower high followed by a fresh lower low will undoubtedly question this uptrend and begin the development of an early (technical) downtrend.

Against the backdrop of the bigger picture, price movement on the H1 timeframe is drawn to Quasimodo support-turned potential resistance from $1.0743 and the $1.07 figure which is closely shadowed by a Quasimodo resistance-turned potential support at $1.0691.

Ultimately, chart studies indicate this is a sellers’ market with the $1.0743 H1 resistance likely to welcome bears to target the $1.07ish neighbourhood. Failure to pullback and visit $1.0743, nevertheless, breakout selling beyond $1.0691/1.07 could be in the offing, according to the longer-term timeframes honing in on at least $1.06.

Charts: TradingView

S&P 500

US equity benchmarks kicked off the week on the ropes, fuelled by Fed concerns. Technically, though, the recent selling does not change the technical landscape across the monthly, weekly and daily charts.

The following is a reminder of where I left (and are likely to leave for the foreseeable future) the monthly chart in recent writing (italics):

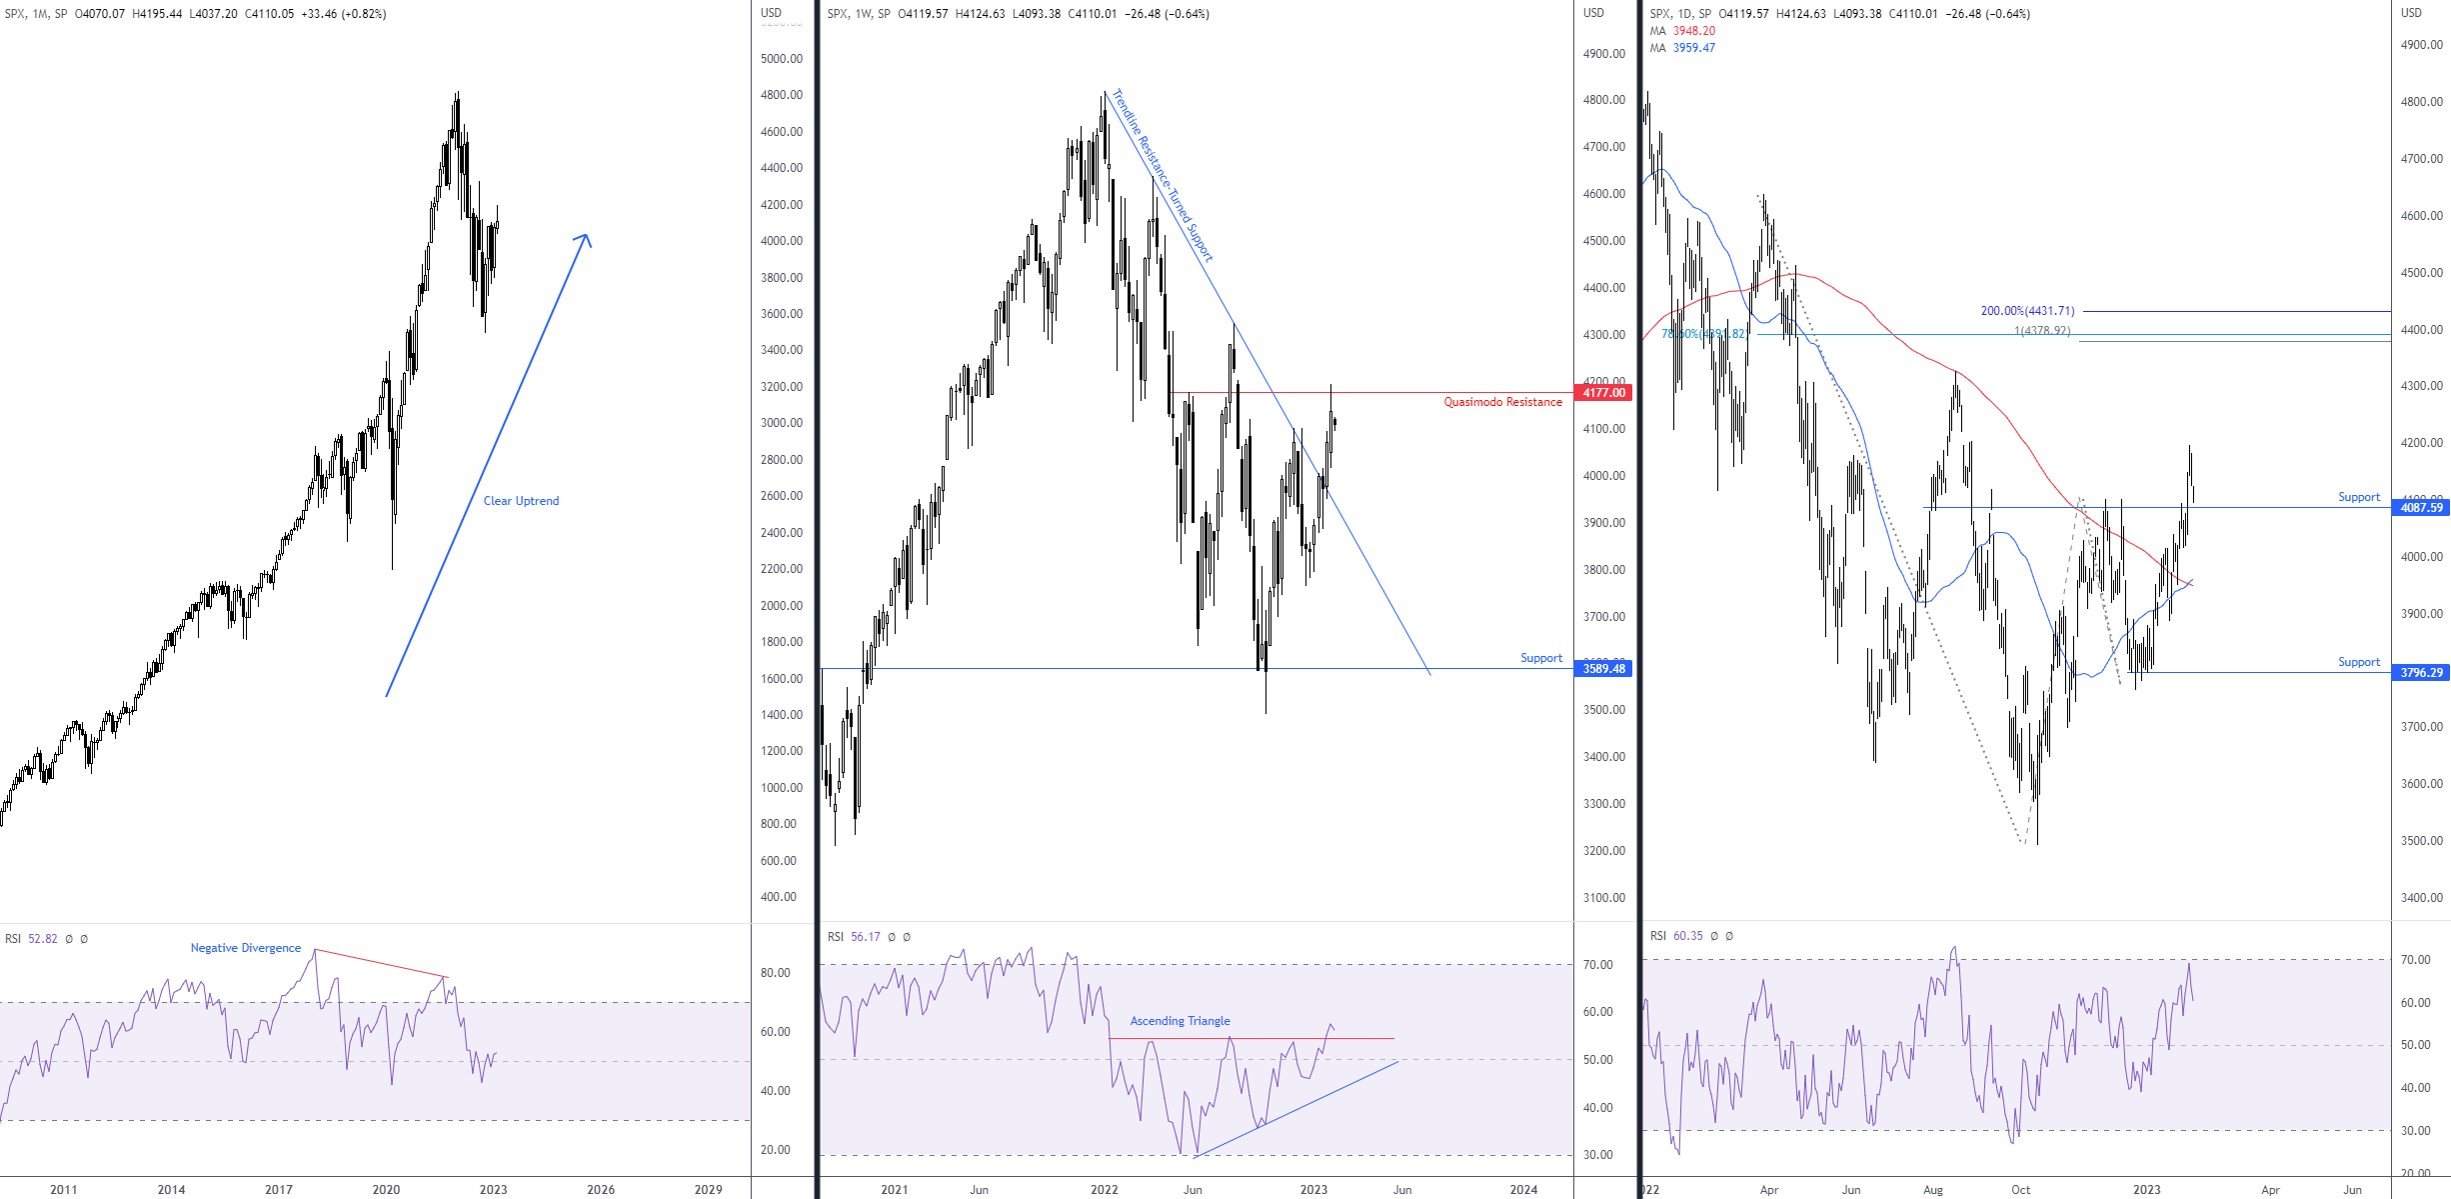
The monthly chart has remained in a dominant uptrend since early 2009. We had two notable corrections in that time, one in early 2020 (COVID), dropping 35%, and one in play since early 2022 (27% from 4,818, as of writing) which was accompanied by negative divergence out of the Relative Strength Index (RSI).

The weekly chart connected with Quasimodo resistance at 4,177 and, thanks to Friday’s surprise jobs data, fostered a mild end-of-week correction from the technical base, closely shadowed by the 4,325 15 August high (2022). Should sellers take hold, a retest of the recently breached trendline resistance (taken from the high at 4,818) could unfold and offer support. However, in support of further buying on this timeframe, the Relative Strength Index (RSI) ventured above the upper boundary of an ascending triangle between 53.72 and 30.47. This emphasises positive momentum until reaching the overbought threshold (70.00). While these triangles are generally found in uptrends, they can also forge reversal signals.

Out of the daily timeframe, 4,087 calls for attention, a potential resistance-turned support with the possibility of price recoiling from here and running for the 4,325 15 August high mentioned on the weekly scale. Of note, and I did reference this in previous analysis, the index continues to extend its position north of the 200-day simple moving average at 3,948, which has remained pointing to the downside since levelling off in April of 2022. We also recently witnessed a Golden Cross form: the 50-day simple moving average (3,959) crossing above the 200-day simple moving average, which is considered a bullish trend signal.

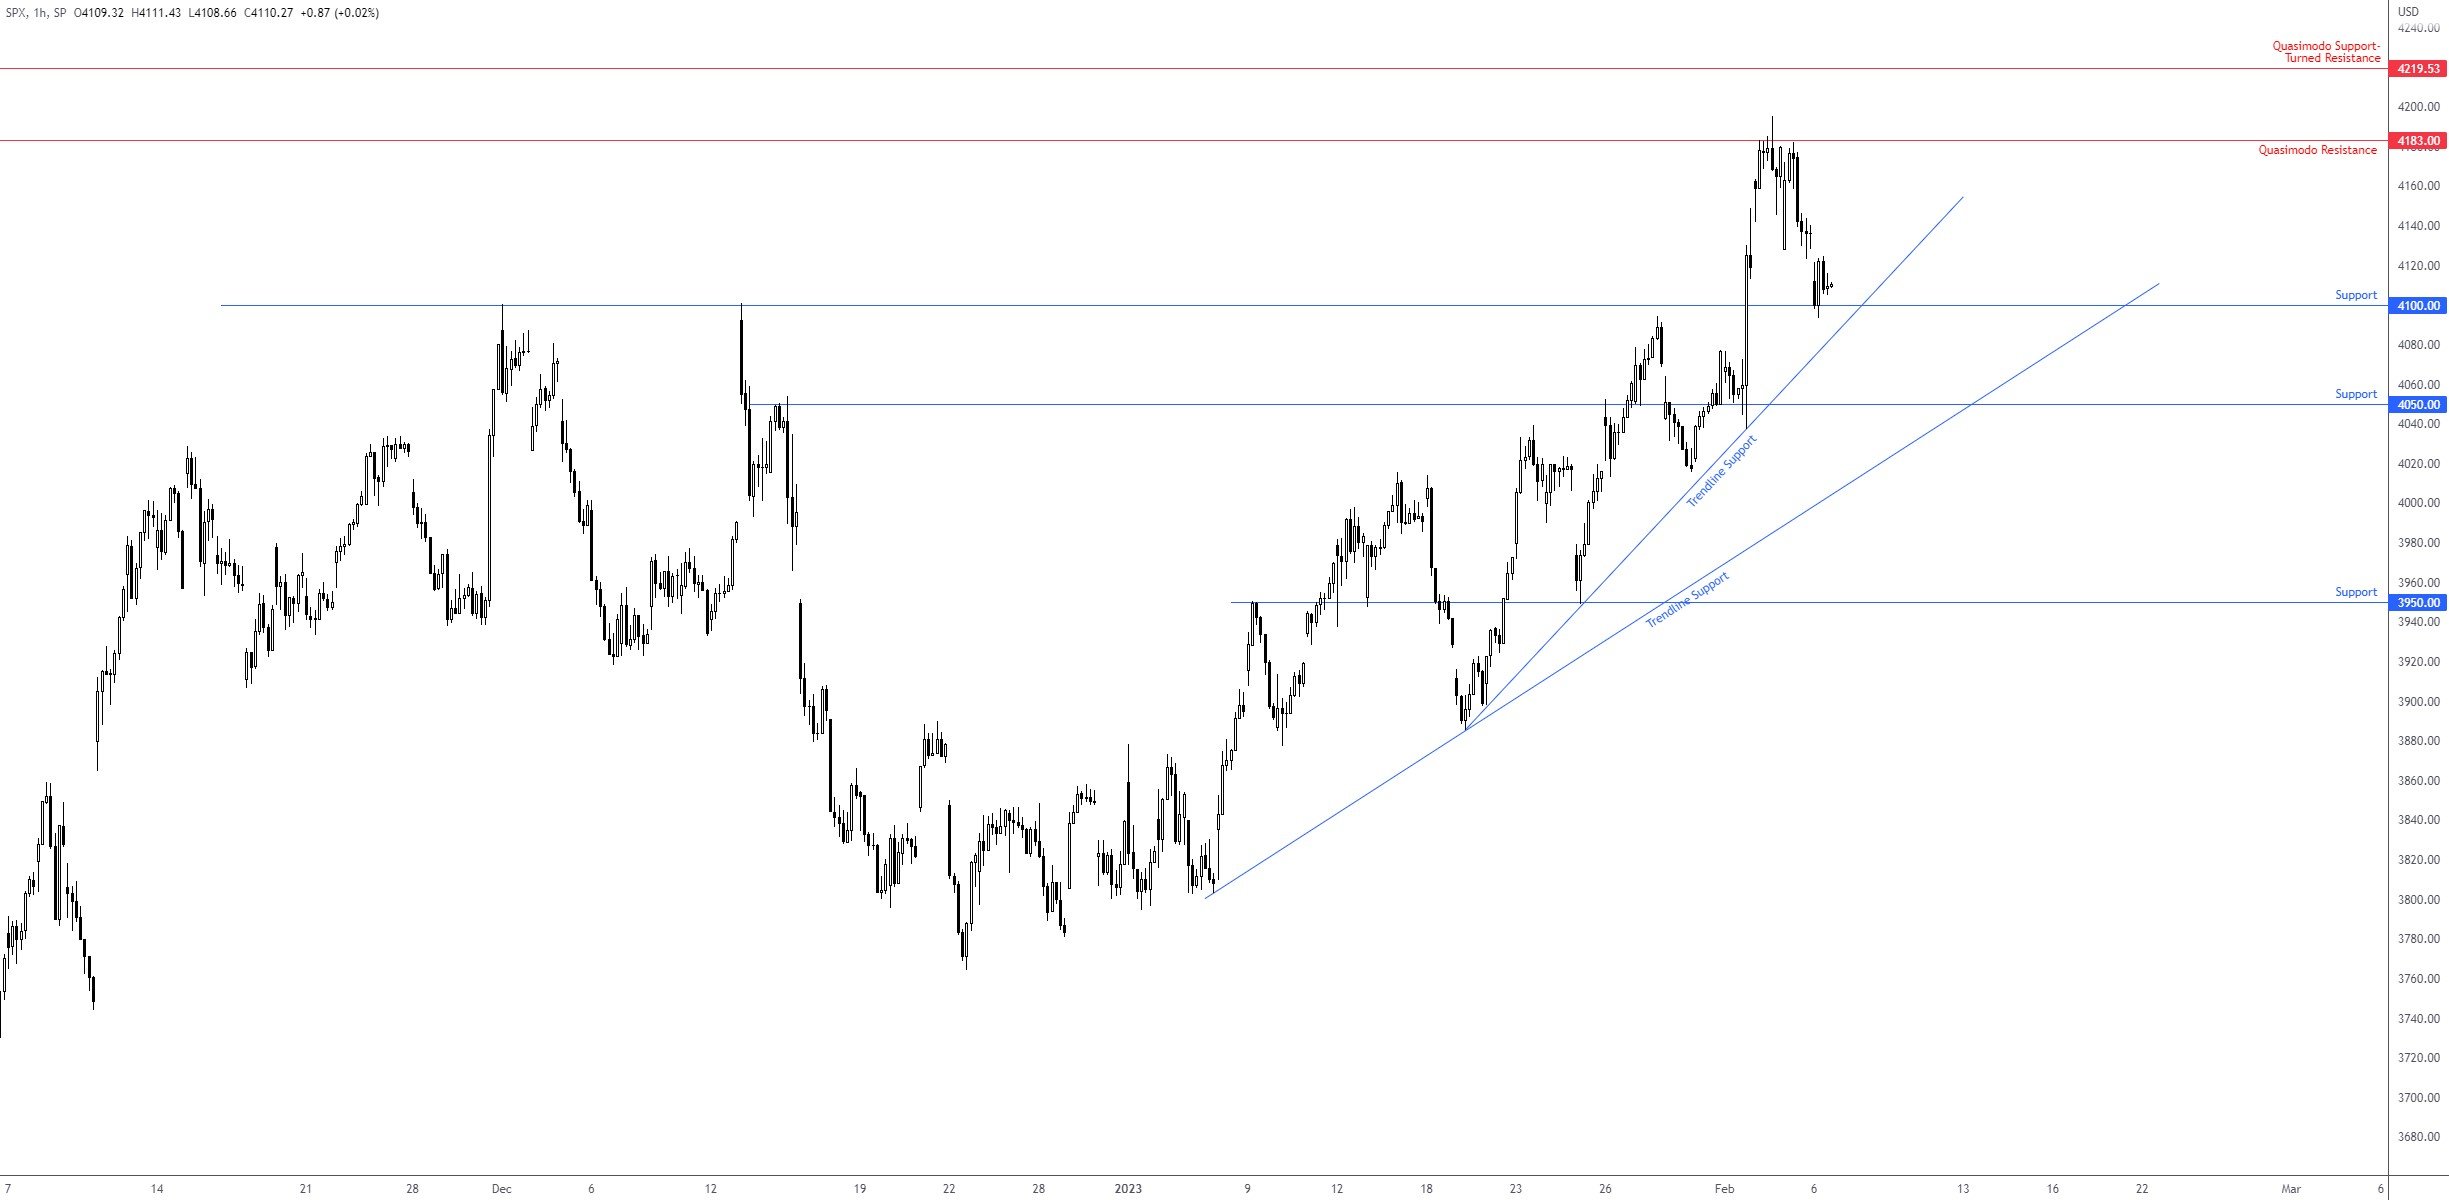
Movement on the H1 timeframe is seen getting to know support at 4,100, positioned closely with trendline support, drawn from the low 3,885. These two levels, therefore, are of immediate concern for short-term traders as a break unearths another layer of support from 4,050 and a neighbouring trendline support, taken from the low 3,803.

Given the technical backdrop, the upper of the two H1 trendline supports, if tested, could deliver a floor for dip buyers, an ascending line complemented by daily support priced at 4,087.

Monthly, Weekly and Daily Charts:

H1 Chart:

Market Analysis

XAU/USD (Gold)

The price of gold ended European trading considerably off best levels versus the US dollar on Monday after H1 price pencilled in a picture-perfect rejection from Quasimodo support-turned resistance from $1,879. This reaffirms not only the scope for short-term flow to zero in on H1 Quasimodo resistance-turned potential support at $1,857, it also shines light on additional underperformance on the weekly and daily timeframes.

Both the weekly and daily timeframes recently touched gloves with overbought conditions on the Relative Strength Index (RSI), with the daily establishing negative divergence and since exploring space below the 50.00 centreline (negative momentum). In addition to this, there is a degree of room for further selling on the daily chart, targeting the 50-day simple moving average at $1,846, followed by support at $1,828 and a 38.2% Fibonacci retracement at $1,827. Just beyond here, the door is open for an approach to weekly support at $1,807.

To avoid repeating myself, my outlook concerning trend structure on the higher timeframes remains unchanged from previous research (italics):

The trend is now technically higher. The trend reversal presented itself in early December last year following the break of the $1,786 previous high in November 2022. Since then, the precious metal also recently welcomed what is known as a Golden Cross, which is the 50-day simple moving average crossing above the 200-day simple moving average ($1,776). This is a pattern trend followers tend to watch and can signal the possibility of a long-term uptrend. However, should the daily chart develop a lower high and a subsequent lower low, this will inform the market that the precious metal has established a bearish trend reversal. The test for this market, therefore, is at the daily support from $1,828.

With current action showing buyers and sellers battling for position around Friday’s session low ($1,861) and all three timeframes echoing room to navigate lower prices, a $1,861 breach could attract breakout selling and propel the yellow metal towards at least H1 Quasimodo resistance-turned potential support at $1,857, and perhaps towards the 50-day simple moving average.

BTC/USD

Following a retest of a breached ascending support line on the H1 timeframe on Saturday, extended from the low $20,370, sellers have been at the wheel. Penetrating nearby support at $23,227 and subsequently serving as resistance pushed the crypto to test the mettle of support from $22,767. As you can see, the aforementioned line withstood several downside attempts with price now poised to retest $23,227. Additional areas of interest on the H1 scale are Quasimodo resistance-turned support at $22,490 and Quasimodo resistance at $23,474.

In light of last week’s bout of selling (down 3.4% and snapping a 4-week winning streak), the support level at $21,924 is a reasonable downside objective on the daily chart and might be enough to prompt dip buying. The fact that the Relative Strength Index (RSI) exited overbought space after reacting from overbought resistance at 89.35 supports selling towards the daily support. An additional technical (bullish) observation on the daily chart bolstering $21,924, of course, is the imminent Golden Cross (the 50-day simple moving average [$19,696] crossing above the 200-day simple moving average [$19,720]) which signals that bulls might seek control and a longer-term uptrend may be on the table.

The weekly timeframe, aside from the bearish candle established last week, remains unchanged. The following echoes thoughts taken from previous research (italics):

In the company of the weekly timeframe’s RSI voyaging north of its 50.00 centreline (followed by positive divergence), BTC/USD appears poised to target a falling wedge (between $25,214 and $17,567) pattern’s profit objective at $25,698, closely trailed by resistance at $28,844.

On account of the noted analysis, the daily timeframe informs investors that sellers could remain in command until joining hands with support at $21,924. This, therefore, places a favourable light on the H1 resistances from $23,227 and $23,474 for a possible move under H1 support at $22,767 towards at least H1 Quasimodo resistance-turned support at $22,490. However, do bear in mind that further downside could materialise beyond here in the direction of $22,000 as this psychological barrier shares a connection with daily support noted above at $21,924.

Technical Market Outlook and Review—7 February, FP Markets


Disclaimer: The information contained in this material is intended for general advice only. It does not take into account your investment objectives, financial situation or particular needs. FP Markets has made every effort to ensure the accuracy of the information as at the date of publication. FP Markets does not give any warranty or representation as to the material. Examples included in this material are for illustrative purposes only. To the extent permitted by law, FP Markets and its employees shall not be liable for any loss or damage arising in any way (including by way of negligence) from or in connection with any information provided in or omitted from this material. Features of the FP Markets products including applicable fees and charges are outlined in the Product Disclosure Statements available from FP Markets website, www.fpmarkets.com and should be considered before deciding to deal in those products. Derivatives can be risky; losses can exceed your initial payment. FP Markets recommends that you seek independent advice. First Prudential Markets Pty Ltd trading as FP Markets ABN 16 112 600 281, Australian Financial Services License Number 286354.

Opinions are personal to the authors and do not reflect the opinions of LeapRate. This is not a trading advice.

Read Also: