Technical analysis: GBP/USD ahead of CPI data

This article was submitted by Aaron Hill from FP Markets.


UK Inflation Data Eyed

Inflation data is scheduled to be released at 7:00 am GMT+1 on Wednesday.

As noted in the Weekly Market Insight:

… According to the Office for National Statistics (ONS), headline YoY inflation eased into single digits in April at 8.7%, down from 10.1% in March (this is still more than four times the BoE’s inflation target and was higher than economists’ estimates [8.3%]). While the slowdown in consumer prices is somewhat positive, core YoY inflation remains a concern. Recent core inflation (removes volatile components such as food and energy) came in above economists’ estimates (6.2%) at 6.8% for April. Wednesday will see the latest UK inflation numbers. Expectations are for headline inflation (YoY) in May to slow to 8.5% (median estimate) with a forecast range between 8.8% and 8.0%. Nevertheless, core YoY inflation for May is anticipated to remain unchanged at 6.8% (forecast range falls in between 6.9% and 6.5%). This core measure will be a notable talking point, particularly if we see a substantial deviation.

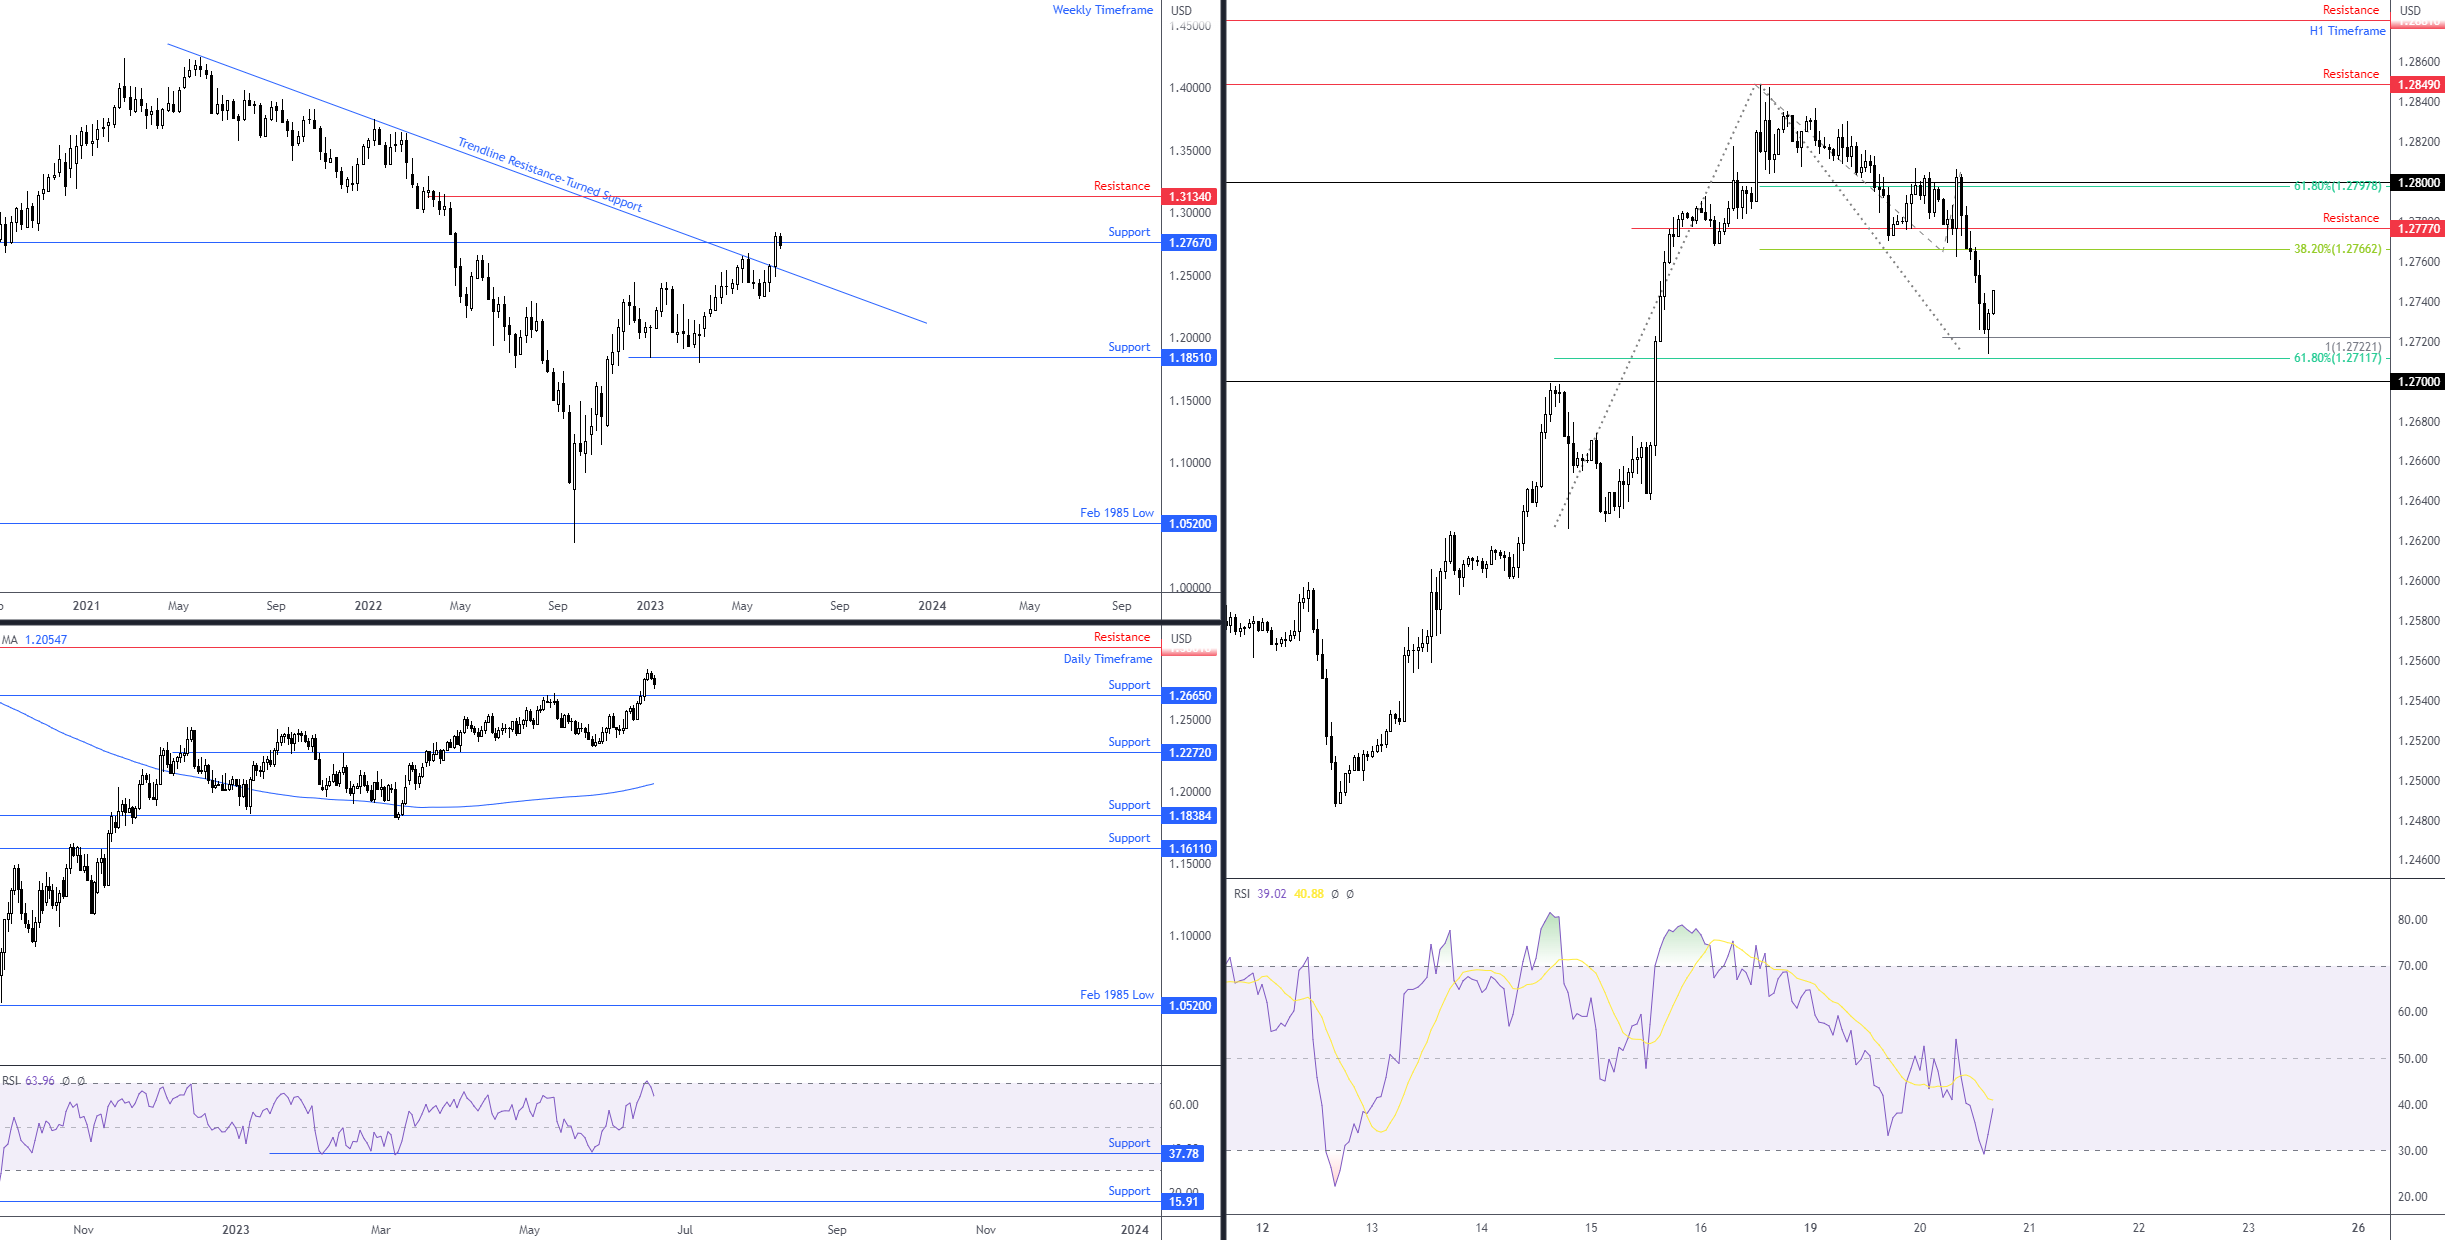
Technical Perspective for GBP/USD

Week to date, sterling is -0.6% lower versus the US dollar. This follows a one-sided rally last week (+1.9%) that pulled the GBP/USD above trendline resistance (taken from the high of $1.4250) and resistance at $1.2767 on the weekly timeframe. At the time of writing, weekly price is seen retesting the aforesaid weekly resistance level which could deliver support.

Reduced retail sales curbs the pound

On the daily timeframe, however, support is not visible until $1.2665, indicating that further downside could be seen for the pair. In terms of resistances, $1.3001 calls for attention on the daily timeframe, followed by weekly resistance at $1.3134.

From the H1 chart, the US cash open welcomed an AB=CD harmonic support level at $1.2722 (denoted by a 100% projection ratio), which happens to be complemented by nearby 38.2% and 61.8% Fibonacci retracement ratios at $1.2712. A reaction, as you can see, has already occurred. In line with weekly price testing potential support, this may lead H1 harmonic traders to plot upside objectives, consisting of 38.2% and 61.8% Fibonacci retracement ratios derived from legs A-D at $1.2766 and $1.2798, respectively. Usually, you’ll also find that traders reduce risk to breakeven at the 38.2% ratio and liquidate a portion of the position and hold in the hope of reaching the 61.8% ratio as a final profit objective.

GBP/USD Ahead of CPI Data, FP MarketsCharts: TradingView


Disclaimer: The information contained in this material is intended for general advice only. It does not take into account your investment objectives, financial situation or particular needs. FP Markets has made every effort to ensure the accuracy of the information as at the date of publication. FP Markets does not give any warranty or representation as to the material. Examples included in this material are for illustrative purposes only. To the extent permitted by law, FP Markets and its employees shall not be liable for any loss or damage arising in any way (including by way of negligence) from or in connection with any information provided in or omitted from this material. Features of the FP Markets products including applicable fees and charges are outlined in the Product Disclosure Statements available from FP Markets website, www.fpmarkets.com and should be considered before deciding to deal in those products. Derivatives can be risky; losses can exceed your initial payment. FP Markets recommends that you seek independent advice. First Prudential Markets Pty Ltd trading as FP Markets ABN 16 112 600 281, Australian Financial Services License Number 286354.

Opinions are personal to the authors and do not reflect the opinions of LeapRate. This is not a trading advice.

Read Also: