
The following article was submitted by Michael Stark, market analyst at Exness.
The economic calendar has taken a backseat to events in the news for most CFD instruments so far this week. With most traders only just returning from holidays at Christmas and New Year, markets have become somewhat more active into the middle of this week.
Tensions between the USA and Iran in Iraq have dominated the news since last week. The American drone strike which killed the Iranian general Qasem Soleimani spurred demand for oil and havens. This has continued somewhat since Monday as the war of words continues; Iran has also launched retaliatory missile attacks against American troops in Iraq.
The most important event in the economic calendar this week is the NFP on Friday. Traders are also looking ahead to tomorrow’s key data from Australia, China and Germany, notably Chinese inflation at 1.30 GMT tomorrow.
Australian dollar-US dollar, four-hour
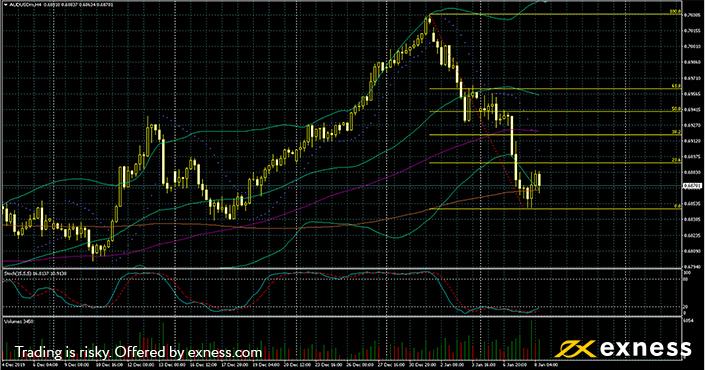
AUDUSD has fallen quite dramatically since the very end of last year mainly as a result of the likely economic impact of the huge bushfires raging across Australia. Moody’s Analytics predicted today that the total cost to the country’s economy is likely to exceed $4.4 billion, the previous grim record set by the fires around Black Saturday in 2009.
Adding to the downward pressure on the Aussie dollar are the growing expectations that the Reserve Bank of Australia is likely to cut its cash rate to 0.25% this year and start quantitative easing. Trade wars, Iranian tensions, Chinese growth and falling prices of some industrial commodities such as aluminium, lead, etc. could also have a significant negative impact on the Aussie dollar this month.
The technical picture at the moment is clearly negative, but it appears that AUDUSD established a support this morning GMT. An attempt to move below the 200-period moving average was rejected: this was followed by an upward engulfing candlestick and a significant increase in buying volume. The slow stochastic has also completed an upward crossover within oversold.
However, any upward correction would probably be limited in the near future. 0.69 is expected to be a very strong psychological resistance. Nevertheless, Friday’s NFP could well alter the technical outlook completely if the result is notably surprising.
Key data points
Bold indicates the most important releases for this symbol.
- Wednesday, 8 January, 13.15 GMT: ADP employment change (December) – consensus 160,000, previous 67,000
- Thursday, 9 January, 0.30 GMT: Australian balance of trade (November) – consensus A$4.15 billion, previous A$4.5 billion
- Thursday, 9 January, 13.30 GMT: initial jobless claims (04 Jan) – consensus 220,000, previous 222,000
- Friday, 10 January, 0.30 GMT: Australian retail sales (monthly, November) – consensus 0.4%, previous 0%
- Friday, 10 January, 13.30 GMT: non-farm payrolls (December) – consensus 164,000, previous 266,000
- Friday, 10 January, 13.30 GMT: American unemployment rate (December) – consensus 3.5%, previous 3.5%
American light oil, four-hour
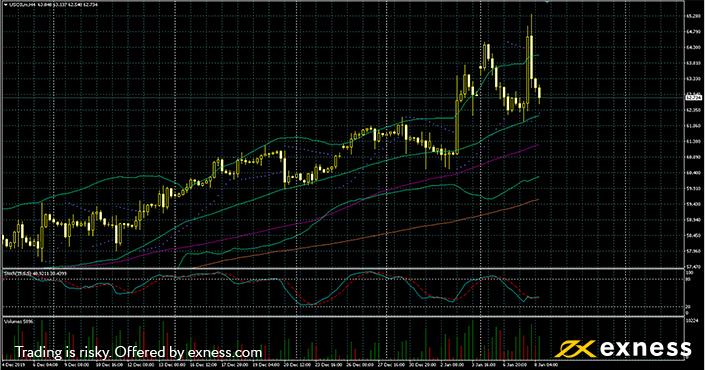
USOIL shot up at the end of last week on the sudden uptick in tension between the USA and Iran. This sort of high tension usually causes a major boost for crude given that the Middle East is one of the world’s most important regions for extraction of the commodity. Oil also received a degree of fundamental support from the API’s stock change data last night; American stocks of crude declined by around 6 barrels per million, only slightly lower than the previous release of about 7.5.
The outlook from the four-hour chart of USOIL is very positive though clearly somewhat unstable at the time of writing. Price is above all three of the 50, 100 and 200 SMAs in turn, buying volume has increased dramatically, and the deviations of Bollinger Bands have expanded. This morning’s price of $65 per barrel was the highest for about nine months. Realistically, though, many traders will wait for a clearer correction instead of buying in here.
Key data points
Bold indicates the most important release for this symbol.
- Wednesday, 8 January, 15.30 GMT: EIA crude oil stock change – consensus -3.57 million, previous -11.46 million
- Thursday, 9 January, 1.30 GMT: Chinese inflation (annual, December) – consensus 4.7%, previous 4.5%
- Thursday, 9 January, 1.30 GMT: Chinese inflation (monthly, December) – consensus 0.3%, previous 0.4%
- Thursday, 9 January, 1.30 GMT: Chinese PPI (annual, December) – consensus -0.4%, previous -1.2%
- Friday, 10 January, 13.30 GMT: non-farm payrolls (December) – consensus 164,000, previous 266, 000
US500, four-hour
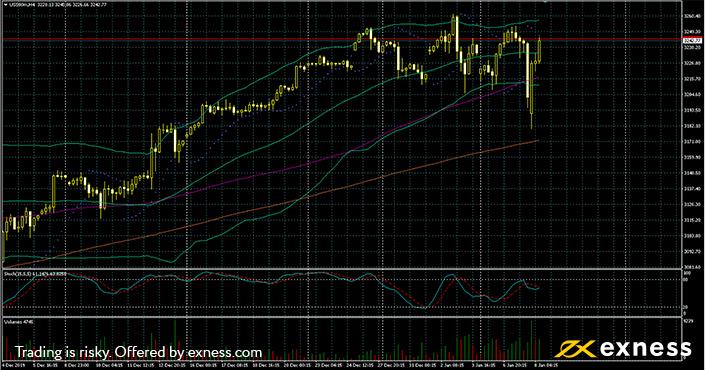
US500 has been volatile in much the same way as oil over the past few days while also sharing oil’s overall gains. The key fundamental factor is, as elsewhere, tension between the USA and Iran. Shares in the defence sector especially Northrop Grumman Corp and Lockheed Martin Corp have surged since last week amid the threat of war. The Sino-American trade war has also taken a backseat in the news to developments in Iraq.
The clearest feature of the chart here is the failed attempt to break out downward just before yesterday’s close. Considerable buying demand exists, so another attempt to break out downward would probably not be any more likely to succeed unless there’s a significant shift in sentiment. As with oil, one can see a clear buy signal from moving averages.
Unlike oil, US500 hasn’t been a clearly overbought. The slow stochastic has now moved out of the zone of buying saturation and price also remains fairly well within the upper deviation of Bollinger Bands. The longer timeframes tell a somewhat different story, though. Quotes above 3260 at the end of last week are all-time highs for this index. Combined with the background of volatility and the NFP coming up on Friday, buying here is extremely risky.
Key data points
Bold indicates the most important release for this symbol.
- Wednesday, 8 January, 13.15 GMT: ADP employment change (December) – consensus 160,000, previous 67,000
- Thursday, 9 January, 13.30 GMT: initial jobless claims (04 Jan) – consensus 220,000, previous 222,000
- Friday, 10 January, 13.30 GMT: non-farm payrolls (December) – consensus 164,000, previous 266,000
- Friday, 10 January, 13.30 GMT: American unemployment rate (December) – consensus 3.5%, previous 3.5%
Disclaimer: any opinions made may be personal to the author and may not reflect the opinions of Exness or LeapRate. This is not a trading advice.