
The following guest post is courtesy of ATFX Global Chief Market Strategist Alejandro Zambrano.
As the new week is underway, metal prices have come under pressure, and gold prices look ready for a significant decline.
Gold prices bottomed out in August 2018, and when crude oil prices and U.S. stock market indices peaked in October 2018, gold prices saw a jump, and the prices eventually gained by 13.94% from their October low of $1180 and reached a high of $1346 in February 2019, according to ATFX gold prices.
Stock markets have since then, much like crude oil prices, bottomed out, and I suspect that the demand for golds’ haven has diminished since then. But gold prices have maintained their lofty prices, and I suspect this might change in the next few days, as prices are once again under pressure.
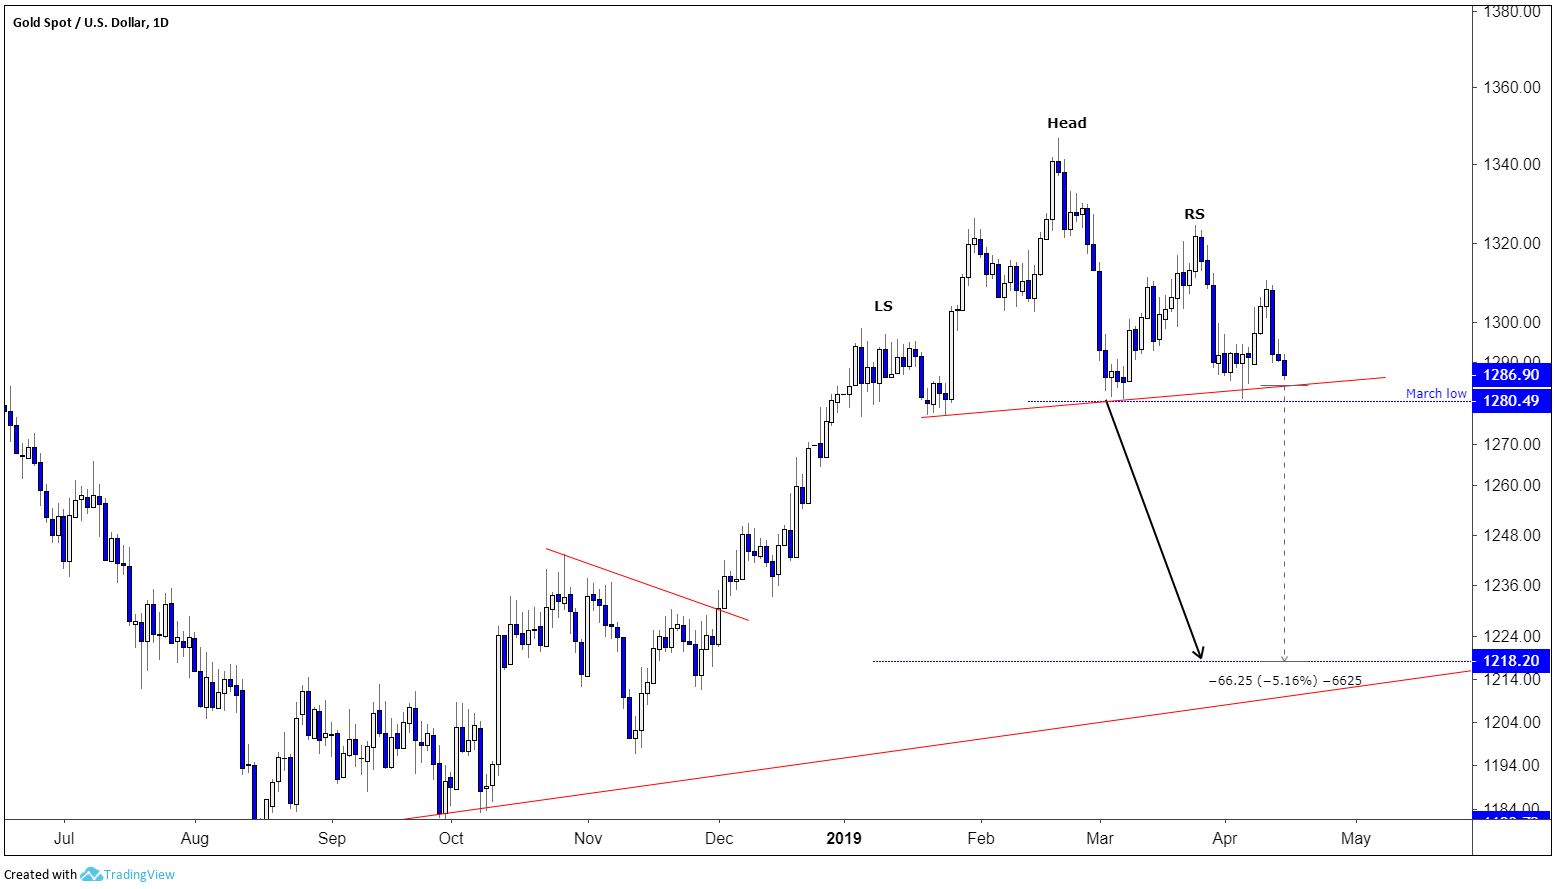
Since early January gold prices has carved out a significant head and shoulders pattern, and the pattern is now indicating that prices might trade as low as $1218.
The pattern is made up of the left shoulder with a high of $1298 formed in January, while the March 25 swing high is probably the right shoulders, and the February 20 high is the pattern head. A trendline can be drawn via the January 24 and March 7 low, and form the neckline of the pattern. To derive the take profit target, we subtract the difference between the head and the neckline level on February 20, from the March 7 low, and thereby arrive that the $1218 level.
There are many ways of trading the pattern, but first, the pattern needs to be triggered, which it will do on a close below the neckline. However, I prefer combining the trend line with an important horizontal level, and the March and April low at $1280.50 is such a low. I think it is important as there should be a good amount of stop-loss orders below the low that could cause prices to accelerate their declined if triggered.
After the completion of a pattern, the price is not allowed to trade back into the pattern. If it does then the completion of the pattern will be treated as false and the pattern will be void.
As for today’s pattern in gold, I will be bearish as long as the price does not trade back into the pattern, and more specifically as long as the price trades above the daily breakout candle high. As an example, if the pattern completes today April 15, then today’s high of $1213 will the trend defining.
Time will tell if the price will complete the pattern or not, but its sure look like the bearish traders are doing their best to trigger another wave of selling, but remember that the head and shoulders pattern will not be active until the pattern completes on a daily close below the March low.
ATFX Gold Prices Daily Chart
Risk Disclaimer:
CFDs are complex instruments and come with a high risk of losing money rapidly due to leverage.
71% of retail investor accounts lose money when trading CFDs / Spread betting with ATFX.
You should consider whether you understand how CFDs / Spread betting work and whether you can afford to take the high risk of losing your money.
This market update was provided with an educational purpose, and is the personal opinion of Alejandro Zambrano, and not to viewed as trading advice by ATFX or Red Castle Ideas LTD.