Using basic charts patterns and correlation, GBPJPY looks set for a correction to the downside this morning.
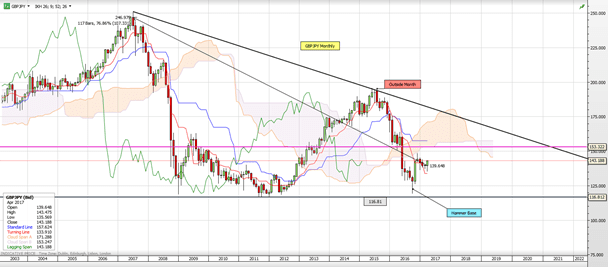
Monthly: The last 117 months of price action has formed a descending triangle formation that has a bias to eventually break lower. The Hammer base from October 2016 offers an immediate upside bias. Last month’s lack of clear direction has been resolved with dip buying. The long-term outlook remains bullish. Resistance seen at 153.30.
Weekly: We have completed a bearish Elliott Wave count at 120.00 and are now deemed to be in the corrective AB-CD leg higher. Last week’s Bullish Outside Week highlights the start of the CD leg. The trend of higher highs is seen at 154.20, just above the aforementioned monthly resistance (at 153.30). This will be a substantial barrier.
Daily: Possible bullish reverse head-and-shoulders pattern. Yesterday’s price action posted a Doji-style candle and highlights a possible temporary top in place. Daily cloud support is seen at 140.65.
Intraday (two-hours): We have four warning signs that a correction is due on this timeframe:
1. Ending Wedge pattern with bearish divergence (measured move 140.00).
2. A correction count posted on the daily chart.
3. The Gap from Sunday open has yet to be closed (139.66).
4. A five-wave pattern looks to be complete.
Intraday (15 minutes): Possible head-and-shoulders. Trendline support (break point) is seen at 142.60. With bespoke support at 142.40 we should be prepared for a possible retest of the breakout level. Measured move is 141.55.
Entry: sell a break of 142.60.
Stop: 143.10.
Target: 141.55 and 14.00.
Time horizon: two or three sessions.
— Edited by Michael McKenna