Background
USDJPY continues to trade in line with the yield on the 10-year US Treasury bond and that market has found its feet after large short positions were squeezed out.
The way is now clear for yields to move higher, if the “hard” economic data starts matching “soft” (survey results) data. The main data points due out this week are retail sales and the consumer price index, which will both be released on Friday.
USD bulls will be hoping the inflation update matches that in the Eurozone, where a poor March result was reversed in April.
Fed funds futures markets have priced in a 90% probability of a rate hike when the Federal Open Market Committee next meets on June 13-14.
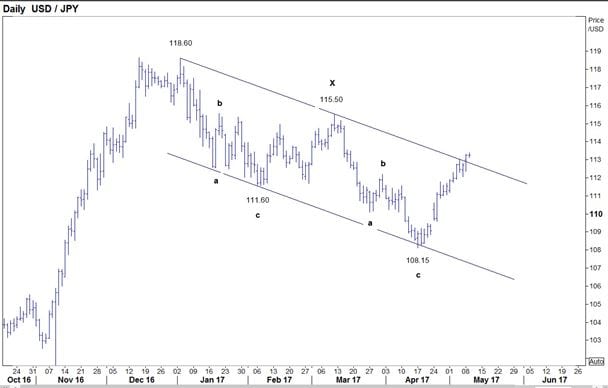
The dollar continues to display a positive Elliott Wave structure for advance toward my medium term objectives of ¥115.50 and ¥118.60 over coming weeks.
In the short term, after having cleared Channel resistance (as shown in the daily chart below), the dollar now has support at ¥113.00/¥112.70, to yield a rally toward the ¥114.60 level, en route to key resistance at ¥115.50/65 .
Entry: Today: Dollar is seen a buy at ¥113.05/¥112.90.
Stop: Just under ¥112.50, initially.
Target: 50% at ¥114.57 and 50% at ¥115.43.
Time horizon: Allow several days for both targets to be met.
Source: ThomsonReuters
Weekly USDJPY chart (click to expand)
Source: ThomsonReuters. Create your own charts with SaxoTrader; click here to learn more.
For more on forex, click here.
— Edited by Robert Ryan
If you would like an email notice each time Max posts a trade, then click here to follow him.
Non-independent investment research disclaimer applies. Read more
A compiled overview of Trade Views provided on TradingFloor.com is found here