Market Overview
It has been a while since Donald Trump did something controversial, so perhaps he got an itch that he just needed to scratch? Trump fired FBI Director James Comey by letter last night in a surprise move that shocked the markets. This was significant as Comey was investigating the claims of the Russian hacking into the US elections. The move has rattled forex markets in early moves with the dollar under pressure. The initial reaction was to put a bid on safe haven plays. Gold and the yen have been strengthened, whilst Treasury yields have dropped and this has dragged the dollar back again. Equities have retreated slightly. These are all likely to be a kneejerk reaction from the market and unlikely to be a sustainable change of direction, but it just also shows how markets are still wary of an unpredictable president. In overnight data, China inflation was mixed with CPI mildly beating expectations but the PPI missing. CPI increased by +0.1% for the month and up to +1.2% for the year (+1.1% exp and higher than the +0.9% last month), whilst the PPI dropping back to 6.4% could raise a few eye brows (+6.8% exp down from +7.6% last month).

Wall Street closed mildly lower was the S&P 500 again shied away from the all-time highs with a close -0.1% at 2397. Asian markets were mixed to mildly positive with the Nikkei +0.3%. European markets are more cautious though with mild losses in early moves. In forex the dollar is mildly corrective across all the major currency pairs, with sterling an outperformer. Gold is around the flat line whilst oil has also formed some support today.
There is a lack of major economic announcements but with political risk reducing in the Eurozone following Macron’s victory, attention turns to how the ECB will respond with monetary policy going forward. Subsequently, there will be a focus on ECB President Mario Draghi’s speech at 1300BST. The EIA oil inventories at 1530BST are expected to show further crude oil stocks drawdown of -1.8m barrels, whilst distillates are expected to drawdown by -0.9m barrels with gasoline stocks in drawdown by -1.3m barrels. The Reserve Bank of New Zealand monetary policy at 2200BST is not expected to change the rates of +1.75%. However focus will be on the press conference and the RBNZ’s outlook for the economy which is expected to be more upbeat. Already shifting to a more neutral stance in 2017, the improving inflation outlook could also be reflected.
Chart of the Day – GBP/JPY
Since Theresa May announced the snap UK general election there has been a massive turnaround in sentiment. The pair has embarked on an enormous recovery uptrend and has posted higher closing levels in each of the past 12 sessions, whilst also running higher daily lows in each of the last 10 sessions. This suggests that intraday corrections continue to be bought into as the market has pushed through a clutch of key resistance levels. However, now is the time for a test of the huge December 2016 key resistance at 148.45. Crucially, a breakout would be the highest level since 24th June (i.e. Brexit). Subsequent resistance would be 151.65/153.65. Momentum indicators are extremely bullish with the RSI solidly in bull territory over 80 and in strong trend mode. The encouraging factor for the bulls though is when yen pairs trend, they really trend strongly. The hourly chart shows support today at 146.40/146.70. A loss of 145.65 would confirm the trend break, whilst 144.65 would begin a correction.

EUR/USD
After the strength of the two bear candles that began the week, today’s session now takes on added importance. The big bearish key one day reversal changed the tone of the chart on Monday and was followed by another strong bear candle that cut another 50 pips and now the key breakout support at $1.0850 is under threat. For now this is simply a bull market correction however, the support is important for the bull control to remain. Furthermore, now the momentum indicators are beginning to be impacted. The Stochastics are crossing back lower, whilst the MACD lines are also close to a bear cross. The early reaction today has been for support to form, leaving yesterday’s low at $1.0860 which is just above the key $1.0850 support. The hourly chart also shows that the recent corrective slide has unwound hourly momentum to a level where the bulls have tended to return. Resistance is initially at $1.0915/$1.0930 before the old $1.0950 range resistance and then the $1.1022 key high. A breach of $1.0850 opens $1.0800 and $1.0777.

GBP/USD
Corrections continue to be seen as a chance to buy and the two mildly corrective candles posted early this week seem to be another opportunity. The bulls may not be surging to pull the market higher however, having been supported above the $1.2775 key breakout there is a sequence of higher lows and higher highs continuing. A higher low at $1.2830 was posted last week and now the market is looking to form another higher low potentially at $1.2900. The concern is that the momentum indicators are not as strong as they once were, despite the run higher. The RSI remains positive above 60 but the MACD lines are losing their impetus and the Stochastics are also teetering on the brink. However, for now the run continues higher. The bulls will be conscious about the $1.2990 high coming just under a $1.3000 psychological barrier, but whilst the $1.2830 reaction low remains intact then the strategy remains buying into weakness. The hourly chart reflects the unwinding moves that are being bought into and a move above yesterday’s high at $1.2960 would help to reassure the nerves.

USD/JPY
The strength of this bull run has been impressive. The uptrend that has formed in the past three weeks has been very well defined and resistance levels continue to be tested and subsequently broken. The market has now retraced back to the 23.6% Fibonacci level of the 100.07/118.65 rally at 114.25 and this has interestingly formed as a barrier. However with the strength of the momentum this is likely to only be a near term stalling with corrections being seen as a chance to buy. The uptrend comes in today at 112.85 whilst the latest breakout was at 113.05 so this gives an initial support area. However, traders of Dollar/Yen will realise that this is a market that tends to trend hard when it gets going, so this 23.6% Fib level is likely to be a consolidation point before further gains are seen. The resistance is yesterday’s high at 114.32 which is now protecting the highs of the old January to March trading band. This means resistance at 115.20 and 115.60 is within range. The hourly chart shows initial support at 113.60 but also the importance of 113.05 now as momentum indicators unwind to renew upside potential.

Gold
With the safe havens under pressure it was surely only a matter of time before gold once more broke lower. The near term attempt to form support around $1225 failed yesterday and the move quickly broke below the old pivot at $1220. Despite not closing below the support, the bearish configuration of the momentum indicators does not bode especially well for this being a basis of support. Having broken the support of $1240 and the uptrend channel since December, the outlook is now under pressure, with the potential for a retreat back towards $1200 and perhaps the key March low at $1194.50. The MACD lines are now falling decisively below negative with the RSI close to 30. The bears will note that during November/December the RSI spent six weeks below 30 as the price continued to slide. The hourly chart shows the negative configuration of hourly momentum, whilst the previous support at $1225 has become a basis of resistance. Subsequent resistance is $1228.60 and then $1236.60. Yesterday’s low at $1213.80 is set to come under further test.

WTI Oil
The oil market looked to be finding support at the back end of last week, but the rally is now being questioned following yesterday’s negative candle again. Technically the response to the bull recovery candle has been somewhat tepid and leads to the implication that rallies very much remain a chance to sell within the recent downtrend. The failure at the overhead supply of the old support at $47.00 is a concern for the bulls, as is the posting of a renewed bear candle under the old downtrend which today comes in at $47.15. Momentum indicators remain negatively configured and there is a sense that the indicators are just bumping along the bottom and any uptick would be seen as renewing downside potential. The hourly chart shows that the loss of support at $45.73 would re-open the downside for a retest of Friday’s low at $43.75.

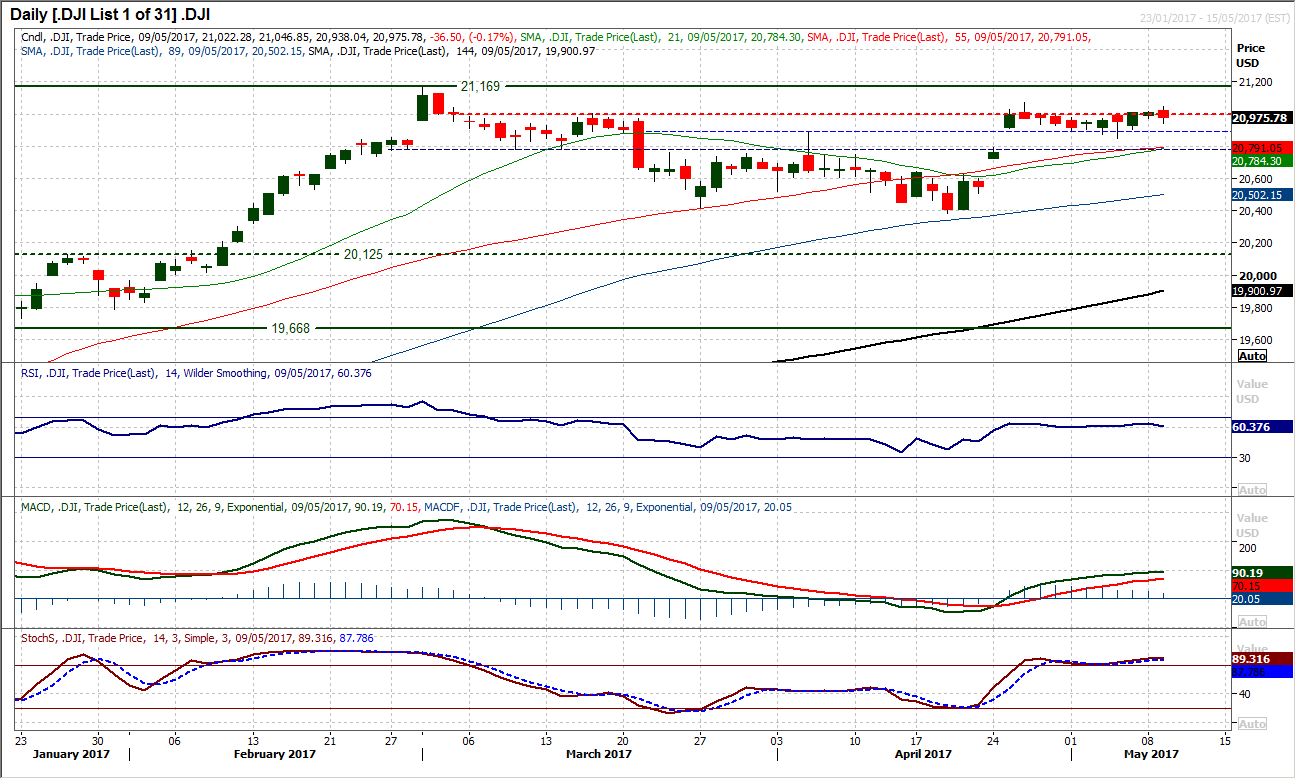
Dow Jones Industrial Average
Once more, when it looked as though the Dow was finally beginning to find some traction, a rally has hit the buffers again. Despite trading for much of the session above 21,000, a late slip back has closed the market back in the range once more. The 21,070 March high remains intact as resistance. However, the latest false start should still just be the precursor to what looks set to be upside pressure, it is just that the bulls continue to stumble. It will now though be important that the market holds the support at 20,905 and of course the 20,848 low however the bulls will still be confident. Momentum indicators remain strong and corrections are being bought into. The RSI remains above 60 but also shows further upside potential, considering the February bull run had the RSI above 70 for much of the month. It still just looks to be a matter of time for the bulls.
