Market Overview
Trading sentiment is increasingly cautious in front of Sunday’s first round of voting for the French Presidential election that is too close to call. Key forex and equity markets are consolidating, with the euro steady, DAX and CAC trading only marginally lower and gold also very much in wait and see mode. An ISIS-claimed terrorist attack in front of the French Presidential election was always a high risk and it will be interesting to see if it makes a difference in the polling for the anti-immigration Marine Le Pen. The shooting of a policeman in Paris last night could play a role in swaying voters however it is not immediately obvious that the stable, statesman-like Macron would suffer over the populist opportunists such as Le Pen or even Melenchon. With so many variables according to the polls, traders do not appear willing to take a view in front of Sundays vote and the volatility is likely to be seen early next week.

Wall Street rallied strongly into the close last night with the S&P 500 +0.8%, with Asian markets also positive (Nikkei +1.0%). European markets are though far more cautious, all trading mixed around the flat line. In forex there is a similar picture developing with almost no direction to speak of across the major pairs, although just as the European session is taking hold there is the slightest air of dollar weakness. Gold is also in consolidation mode early today, trading just $2 lower, whilst oil has just started to stabilise a touch after several days of selling pressure.
Traders will have plenty to keep them entertained in the early part of the European session, with the Eurozone flash PMIs initially in focus. Expectations suggest that French and German PMIs will hold up on both manufacturing and services. This should mean little real move for the Eurozone flash Manufacturing PMI at 0900BST which is forecast to dip slightly to 56.1 (from 56.2) and the Eurozone flash Services PMI to stick at the 56.0 from last month. UK Retail Sales at 0930BST are expected to drop by -0.4% for the month on an adjusted ex-fuel basis meaning that the year on year data to be trimmed back to +3.9% (+4.1% exp). Canadian CPI inflation at 1330BST is expected to be +0.4% for the month but would be dropped to +1.8% for the year (from +2.0%). US flash Manufacturing PMI at 1445BST is expected to improve to 53.9 (from 53.3) whilst the US flash Services PMI is expected to dip slightly to 53.7 (from 53.8).
Chart of the Day – EUR/JPY
With the euro pulling higher on Macron’s positive polling as the French election becomes imminent, this has helped to drive EUR/JPY into a recovery phase. Four strong bull candles now threatens to completely change the outlook which has been trending lower over the past six weeks. However, a pullback late in yesterday’s session could now question this recovery. The move had looked to threaten the confluence of the underside resistance of the long term uptrend and the resistance of a six week downtrend, but the initial test was sold into. However, today’s session could be one of consolidation, but this could all change on Monday as a market positive outcome (Macron leading the first round poll) could help to drive an upside break. The momentum indicators are also now improving. The Stochastics have given a near term bull signal, whilst the MACD lines are also now both crossing higher. A test of the resistance at 118.20 could also be on. If the market can pull above the resistance of the overhead supply from the key February low at 118.20 then the bulls would certainly be in a far more positive position. The hourly chart reflects the improving outlook, trading above rising moving averages, positively configured momentum and a series of higher lows. The initial support is in the band 116.50/116.95 with 115.75 now key to the near to medium term recovery. Yesterday’s high is resistance at 117.80 whilst above 118.20 opens 118.80.

EUR/USD
The bulls will be concerned by the late decline in yesterday’s session that pulled the market around 55 pips from the day high to close around the low. This has subsequently formed something close to a shooting star one day candlestick pattern. This would be a bearish pattern if followed by further moves to the downside today. However, although it is still very early, signs are that in the final day of trading before the French election the market could well be running into a consolidation day. The bulls would still be keen to hold on to the support band $1.0680/$1.0710 however hourly indicators are showing little real momentum for direction as yet. The outcome of the French election could be pivotal for the near term euro direction and given the uncertainty, traders may find little reason to take a view. Resistance is now $1.0777.

GBP/USD
Since the breakout above $1.2775, Cable has been looking to build a new basis of support. The last two sessions have been looking to balance the market rather than continuing the push higher. The original breakout was on the political events in the UK and this could continue to drive sterling. However the resistance at $1.2905 has held for the past couple of sessions now and is subsequently growing in importance. The hourly chart shows a basis of resistance also tighter at $1.2860. However it is also interesting to see that the bulls do not want to give up the breakout either. A test of the $1.2775 support was briefly breached to $1.2765 but quickly regained and is now holding. Hourly momentum has unwound and is developing something of a consolidation. A decisive breach of $1.2775 opens a previous breakout back within the range at $1.2707. The bulls will be looking to break above $1.2905. to open the psychological $1.3000.

USD/JPY
The dollar has started to claw back some of the lost ground with a couple of positive candles in the past two sessions which are looking to improve the near term outlook. However, Dollar/Yen has a history of consolidating the breakdowns before further downside sets in. The downside break below the support at 110.09 means that there is a band of overhead supply sitting ready for any rally. Furthermore the 50% Fib retracement at 109.35 is also a basis of resistance. For now, the configuration of the momentum indicators suggests that this will again be the case. The RSI and Stochastics have reacted with the mini rally but have not broken their negative phases and suggests that rallies are a chance to sell. The hourly chart has a slightly positive set up for a continuation of the recovery but with the overhead supply shown on the daily chart, any sell signal into the 109.35/110.09 range looks to be a chance to sell. Initial support is 108.75. which now protects 108.30 and the key low at 108.11.

Gold
The bulls have just taken a pause for breath this week as the market has consolidated. A move back from the high at $1295.40 has just looked to unwind some of the stretched momentum. There is still the potential for a near term pull back into the $1261/$1271 support area which houses a series of old highs from February/March but for now the market is consolidating. This comes ahead of the French Presidential election on Sunday which could help to drive near term direction. Technically, the medium term outlook remains strong and corrective moves are a chance to buy. The key barrier remains $1300 which is a historic pivot. The hourly chart shows a quiet market into this morning, lacking direction that comes with traders unwilling to take a view ahead of Sunday’s vote. Initial support is at $1275, with resistance at $1286.

WTI Oil
After such a strong bear candle in the wake of the EIA inventories the bulls would have hoped for a bounce back, but the market reversed its early gains to close lower again on the day as the outlook remains under pressure. However, the support has remained firm around $50.00 which was all but Wednesday’s low and this psychological level remains intact. With the market now having retraced around 50% of the late March rally, there are now a range of old key levels which are providing a mix of signals between $49.60/$51.22. This means that the direction of the market out of this range will be considered as key for the medium term outlook which is becoming increasingly choppy. The near term pressure remains to the downside with the corrective look to the Stochastics and the MACD lines and this suggests an appetite still to sell into strength. The hourly chart also shows negative near term configuration. The resistance is now between $51.00/$51.50, with $49.90/$50.10 supportive.

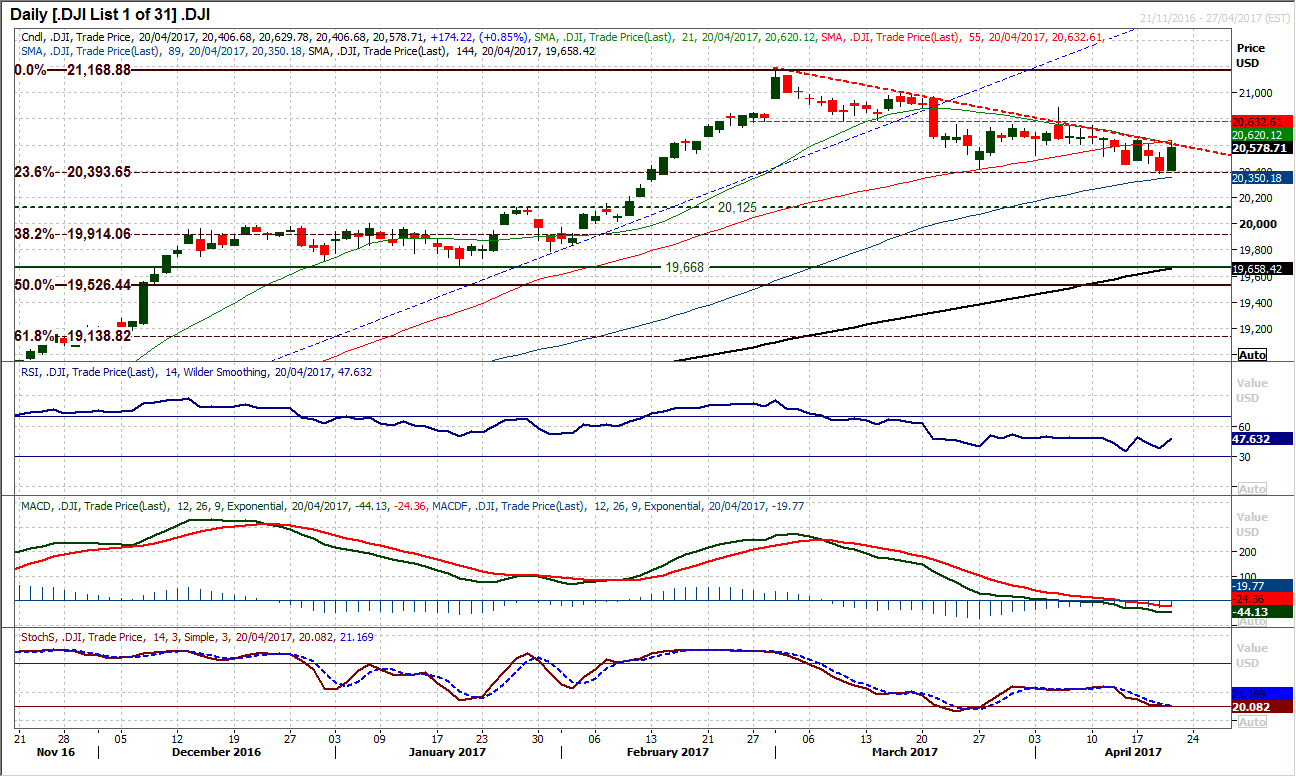
Dow Jones Industrial Average
With the market in the continued corrective downtrend that has formed over the past seven weeks, rallies remain a chance to sell. Despite yesterday’s strong bull candle, the trend is your friend, and in this case for the Dow, the trend is down. This holds with momentum indicators correctively configured as the RSI is now failing in the 50/55 area and MACD lines and Stochastics are negative. The bull candle from yesterday helped to pull the market higher but this still seems to be a move counter to the trend which today comes in to lend resistance around 20,600. Subsequently, today’s candle could be key for the near term outlook. Despite this though, the support remains intact at the 23.6% Fibonacci retracement of the big Trump inspired rally of 17,884/21,169 at 20,394. However this Fib level would remain under pressure if the market continues to trend lower and a breach would open 38.2% Fib at 19,914 with the next support at 20,125. The hourly chart shows that rallies are increasingly seen as a chance to sell, with resistance initially in the band 20,518/20,550.
