The short and long-term bias are now bearish after sellers re-emerged on Friday. Here is the outlook and the prime short entry level for Monday.
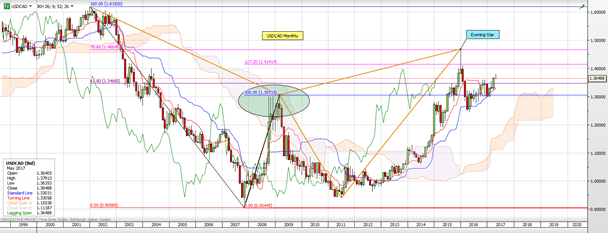
Monthly: We are holding onto the slightly disjointed bearish Gartley formation. The next downside long-term support and an area that has been pivotal is 1.2000 (bearish).
Weekly: For the last 56 weeks we have held within a corrective bullish channel formation. Nearly all last week’s initial gains were sold into close to the 61.8% Fibonacci level of 1.3837 (1.3791 high print) resulting in a bearish Inverted Hammer on the weekly chart.
A weekly close below 1.3509 (on May 12) will, in turn, post an Evening Doji Star and give further strength to the outlook (bearish). Trend line and Ichimoku Cloud support is seen at 1.3210 and is our first medium-term target.
USDCAD weekly
Daily: USDCAD completed the last corrective AB=CD leg on Friday (nearly pip perfect). The strong rejection of gains resulted in a bearish Outside Day being posted on the daily chart, a strong indication of a change of trend.
Reverse trend line support (from the channel breakout) can be seen close to 1.3340 and is the short term or immediate swing level (bearish).
USDCAD daily
Intraday (15 minutes): We look to have completed an Elliott Wave (5) count (bearish) which flips the bias to the downside. With bespoke support at 1.3640, there is ample scope for a corrective bounce at the open.
Resistance is seen at 1.3716-1.3722. With a stop above Friday’s high (1.3791) this makes for a solid risk/reward trade both intraday and medium term.