The following article was written by Ipek Ozkardeskaya, Senior Market Analyst at FCA regulated broker London Capital Group Holdings plc (LON:LCG).

Ipek Ozkardeskaya, LCG
The Dow Jones dropped more than 3% percent after hitting the historical high level of 21,170 on February 28th as a result of an unprecedented ‘reflation’ rally, that reflated the Dow Jones by more than 20% in four months only.
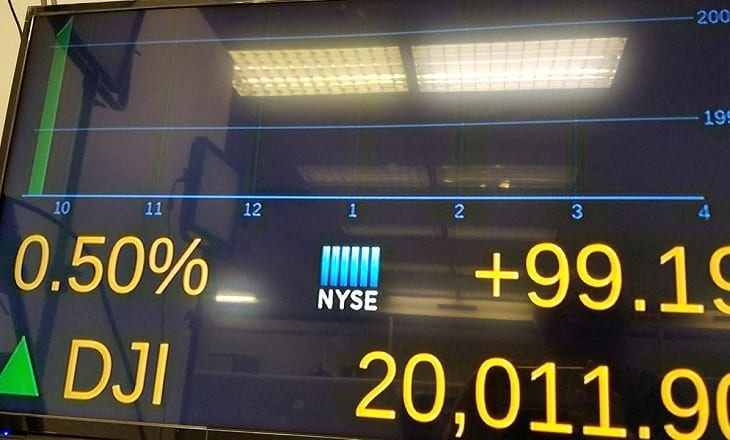
The Dow recorded the fastest 1,000 point rally in its history from 20,000 to 21,000. Technical indicators pointed at an overbought market during the major part of the rally period.
Investors have massively bought into the new US President Donald Trump’s expansive fiscal plans, including tax reforms and infrastructure spending. As the Dow Jones frequently renewed record from November 2016 to February 29017, traders often wondered whether the market has gone ahead of itself. Nevertheless, the momentum was very strong to let the stock buyers down until the end of February.
A combination of different economic and political factors caused price stagnation in the Down Jones since the beginning of March. First, the Federal Reserve (Fed) announced what is called a ‘dovish’ rate hike at the March meeting, which basically readjusted the market expectations about Trump’s fiscal spending. Second, Donald Trump appeared to have hard time pushing through his campaign promises. The lack of details regarding the tax cuts and the spending program raised several questions and has apparently discouraged some investors from building further long positions in the US stock markets before more details would come in.
As such, the sell-off in the Dow Jones accelerated over the past week, when the index recorded its biggest fall since November 9th. In fact, the Dow Jones Industrial index lost over four out of the five past trading sessions during the week following the Fed meeting.
The downside correction in the US stocks could intensify. The recent pullback raised several questions on whether the Trump-reflation rally is over and what is the potential of a further drop.
The Dow Jones retreated below the 50-day moving average (20,490) for the first time since Donald Trump’s election on November 9th.
From a technical point of view, there is potential for a deeper downside correction.
The 14-day RSI (Relative Strength Index) stepped below the 50 level for the first time since November 9th, yet the market is still comfortably far from the ‘oversold’ conditions, which would imply the RSI slipping below the 30 level.
The MACD (Moving Average Convergence Divergence), which is a popular indicator of momentum, has deteriorated to the lowest levels since the Trump rally started on November 9th. The Dow Jones is preparing to step into the bearish territory for the first time since November, which suggests that the sell-off could pick-up further momentum.
The next important technical level is eyed at 20,293, the minor 23.6% retracement on November 9th to February 28th rally. Breaking this level would pave the way for the critical psychological level of 20,000.
From a purely technical perspective, even a pullback to 20,000 is not sufficient to tell that the Dow Jones has reversed the mid-term trend.
The major support to the post-Trump bullish trend stands at 19,754.2, the major 38.2% retracement. Only breaking this level, the Dow Jones would step in the bearish consolidation zone.
